Cheyenne vs Moroccan Female Unemployment
COMPARE
Cheyenne
Moroccan
Female Unemployment
Female Unemployment Comparison
Cheyenne
Moroccans
6.6%
FEMALE UNEMPLOYMENT
0.0/ 100
METRIC RATING
324th/ 347
METRIC RANK
5.5%
FEMALE UNEMPLOYMENT
3.4/ 100
METRIC RATING
233rd/ 347
METRIC RANK
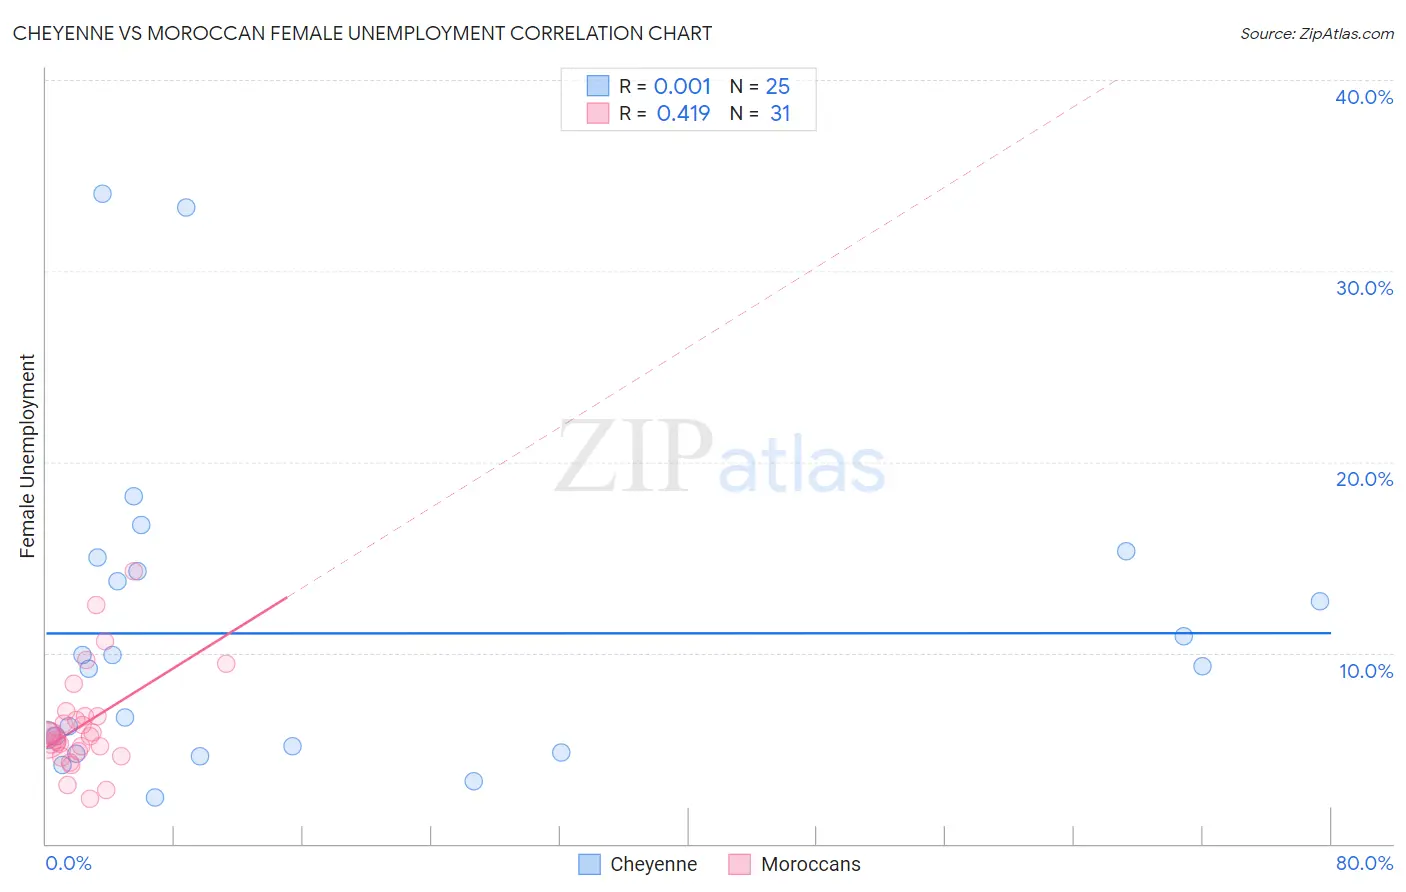
Cheyenne vs Moroccan Female Unemployment Correlation Chart
The statistical analysis conducted on geographies consisting of 80,481,122 people shows no correlation between the proportion of Cheyenne and unemploymnet rate among females in the United States with a correlation coefficient (R) of 0.001 and weighted average of 6.6%. Similarly, the statistical analysis conducted on geographies consisting of 201,565,511 people shows a moderate positive correlation between the proportion of Moroccans and unemploymnet rate among females in the United States with a correlation coefficient (R) of 0.419 and weighted average of 5.5%, a difference of 19.0%.
Female Unemployment Correlation Summary
| Measurement | Cheyenne | Moroccan |
| Minimum | 2.4% | 2.3% |
| Maximum | 34.0% | 14.3% |
| Range | 31.6% | 11.9% |
| Mean | 11.0% | 6.3% |
| Median | 9.3% | 5.6% |
| Interquartile 25% (IQ1) | 5.0% | 4.8% |
| Interquartile 75% (IQ3) | 14.6% | 6.7% |
| Interquartile Range (IQR) | 9.7% | 1.9% |
| Standard Deviation (Sample) | 8.2% | 2.7% |
| Standard Deviation (Population) | 8.0% | 2.6% |
Similar Demographics by Female Unemployment
Demographics Similar to Cheyenne by Female Unemployment
In terms of female unemployment, the demographic groups most similar to Cheyenne are Apache (6.6%, a difference of 0.27%), Native/Alaskan (6.6%, a difference of 0.83%), Alaska Native (6.6%, a difference of 0.91%), Immigrants from Belize (6.5%, a difference of 1.1%), and Vietnamese (6.5%, a difference of 1.2%).
| Demographics | Rating | Rank | Female Unemployment |
| Immigrants | St. Vincent and the Grenadines | 0.0 /100 | #317 | Tragic 6.4% |
| British West Indians | 0.0 /100 | #318 | Tragic 6.4% |
| Immigrants | Bangladesh | 0.0 /100 | #319 | Tragic 6.5% |
| Immigrants | Dominica | 0.0 /100 | #320 | Tragic 6.5% |
| Blacks/African Americans | 0.0 /100 | #321 | Tragic 6.5% |
| Vietnamese | 0.0 /100 | #322 | Tragic 6.5% |
| Immigrants | Belize | 0.0 /100 | #323 | Tragic 6.5% |
| Cheyenne | 0.0 /100 | #324 | Tragic 6.6% |
| Apache | 0.0 /100 | #325 | Tragic 6.6% |
| Natives/Alaskans | 0.0 /100 | #326 | Tragic 6.6% |
| Alaska Natives | 0.0 /100 | #327 | Tragic 6.6% |
| Guyanese | 0.0 /100 | #328 | Tragic 6.7% |
| Immigrants | Guyana | 0.0 /100 | #329 | Tragic 6.7% |
| Yakama | 0.0 /100 | #330 | Tragic 6.7% |
| Paiute | 0.0 /100 | #331 | Tragic 6.8% |
Demographics Similar to Moroccans by Female Unemployment
In terms of female unemployment, the demographic groups most similar to Moroccans are Immigrants from Lebanon (5.5%, a difference of 0.020%), Immigrants from Iran (5.5%, a difference of 0.030%), Immigrants from Cambodia (5.5%, a difference of 0.060%), Immigrants from Panama (5.5%, a difference of 0.080%), and Sierra Leonean (5.5%, a difference of 0.10%).
| Demographics | Rating | Rank | Female Unemployment |
| Immigrants | Peru | 5.9 /100 | #226 | Tragic 5.5% |
| Immigrants | Philippines | 5.3 /100 | #227 | Tragic 5.5% |
| Israelis | 4.8 /100 | #228 | Tragic 5.5% |
| Panamanians | 4.7 /100 | #229 | Tragic 5.5% |
| Immigrants | Uruguay | 4.7 /100 | #230 | Tragic 5.5% |
| Immigrants | Iraq | 3.9 /100 | #231 | Tragic 5.5% |
| Liberians | 3.9 /100 | #232 | Tragic 5.5% |
| Moroccans | 3.4 /100 | #233 | Tragic 5.5% |
| Immigrants | Lebanon | 3.3 /100 | #234 | Tragic 5.5% |
| Immigrants | Iran | 3.3 /100 | #235 | Tragic 5.5% |
| Immigrants | Cambodia | 3.3 /100 | #236 | Tragic 5.5% |
| Immigrants | Panama | 3.2 /100 | #237 | Tragic 5.5% |
| Sierra Leoneans | 3.2 /100 | #238 | Tragic 5.5% |
| Aleuts | 3.0 /100 | #239 | Tragic 5.5% |
| Immigrants | South America | 2.9 /100 | #240 | Tragic 5.5% |