Immigrants from Canada vs Immigrants from Afghanistan Female Unemployment
COMPARE
Immigrants from Canada
Immigrants from Afghanistan
Female Unemployment
Female Unemployment Comparison
Immigrants from Canada
Immigrants from Afghanistan
4.9%
FEMALE UNEMPLOYMENT
98.6/ 100
METRIC RATING
61st/ 347
METRIC RANK
5.4%
FEMALE UNEMPLOYMENT
18.9/ 100
METRIC RATING
205th/ 347
METRIC RANK
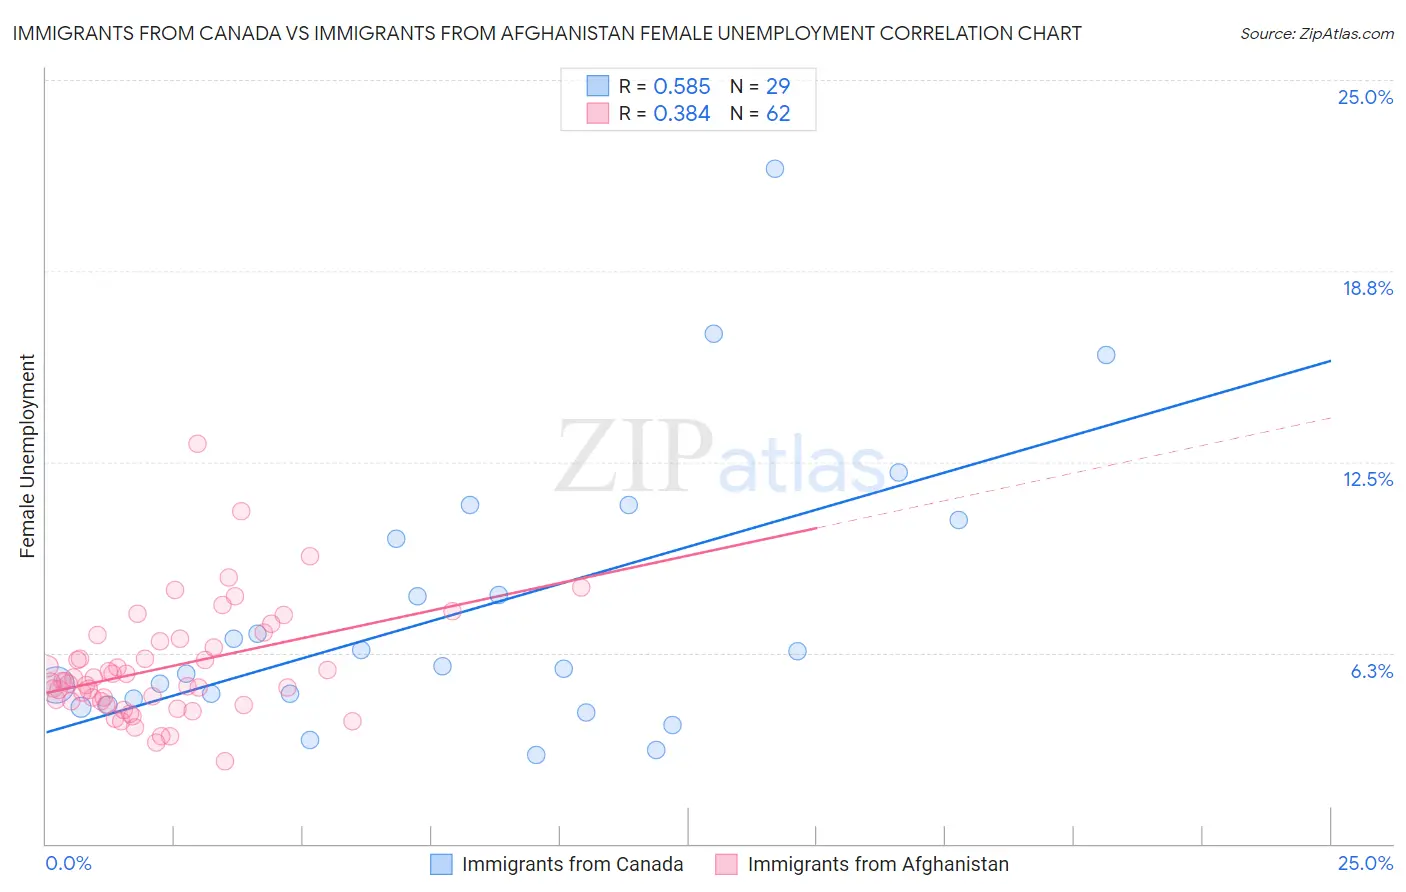
Immigrants from Canada vs Immigrants from Afghanistan Female Unemployment Correlation Chart
The statistical analysis conducted on geographies consisting of 455,102,288 people shows a substantial positive correlation between the proportion of Immigrants from Canada and unemploymnet rate among females in the United States with a correlation coefficient (R) of 0.585 and weighted average of 4.9%. Similarly, the statistical analysis conducted on geographies consisting of 147,540,381 people shows a mild positive correlation between the proportion of Immigrants from Afghanistan and unemploymnet rate among females in the United States with a correlation coefficient (R) of 0.384 and weighted average of 5.4%, a difference of 9.1%.
Female Unemployment Correlation Summary
| Measurement | Immigrants from Canada | Immigrants from Afghanistan |
| Minimum | 2.9% | 2.7% |
| Maximum | 22.1% | 13.1% |
| Range | 19.2% | 10.4% |
| Mean | 7.6% | 5.8% |
| Median | 5.8% | 5.3% |
| Interquartile 25% (IQ1) | 4.6% | 4.6% |
| Interquartile 75% (IQ3) | 10.3% | 6.6% |
| Interquartile Range (IQR) | 5.7% | 2.0% |
| Standard Deviation (Sample) | 4.5% | 1.8% |
| Standard Deviation (Population) | 4.5% | 1.8% |
Similar Demographics by Female Unemployment
Demographics Similar to Immigrants from Canada by Female Unemployment
In terms of female unemployment, the demographic groups most similar to Immigrants from Canada are Immigrants from Nepal (4.9%, a difference of 0.0%), Immigrants from Scotland (4.9%, a difference of 0.010%), Bhutanese (4.9%, a difference of 0.090%), Immigrants from Belgium (4.9%, a difference of 0.12%), and Celtic (4.9%, a difference of 0.12%).
| Demographics | Rating | Rank | Female Unemployment |
| Immigrants | Zimbabwe | 99.0 /100 | #54 | Exceptional 4.9% |
| Immigrants | Moldova | 99.0 /100 | #55 | Exceptional 4.9% |
| Serbians | 99.0 /100 | #56 | Exceptional 4.9% |
| Icelanders | 98.8 /100 | #57 | Exceptional 4.9% |
| Immigrants | Lithuania | 98.8 /100 | #58 | Exceptional 4.9% |
| Bhutanese | 98.7 /100 | #59 | Exceptional 4.9% |
| Immigrants | Scotland | 98.6 /100 | #60 | Exceptional 4.9% |
| Immigrants | Canada | 98.6 /100 | #61 | Exceptional 4.9% |
| Immigrants | Nepal | 98.6 /100 | #62 | Exceptional 4.9% |
| Immigrants | Belgium | 98.5 /100 | #63 | Exceptional 4.9% |
| Celtics | 98.5 /100 | #64 | Exceptional 4.9% |
| Immigrants | North America | 98.3 /100 | #65 | Exceptional 4.9% |
| Hungarians | 98.3 /100 | #66 | Exceptional 4.9% |
| Cubans | 98.3 /100 | #67 | Exceptional 4.9% |
| Tlingit-Haida | 98.3 /100 | #68 | Exceptional 4.9% |
Demographics Similar to Immigrants from Afghanistan by Female Unemployment
In terms of female unemployment, the demographic groups most similar to Immigrants from Afghanistan are Immigrants from Brazil (5.4%, a difference of 0.020%), Immigrants from Israel (5.4%, a difference of 0.070%), Immigrants from South Eastern Asia (5.4%, a difference of 0.13%), Immigrants from Middle Africa (5.4%, a difference of 0.18%), and Iroquois (5.4%, a difference of 0.18%).
| Demographics | Rating | Rank | Female Unemployment |
| Tsimshian | 23.1 /100 | #198 | Fair 5.4% |
| Hawaiians | 22.2 /100 | #199 | Fair 5.4% |
| Soviet Union | 21.7 /100 | #200 | Fair 5.4% |
| Immigrants | Middle Africa | 20.8 /100 | #201 | Fair 5.4% |
| Iroquois | 20.8 /100 | #202 | Fair 5.4% |
| Immigrants | South Eastern Asia | 20.3 /100 | #203 | Fair 5.4% |
| Immigrants | Israel | 19.7 /100 | #204 | Poor 5.4% |
| Immigrants | Afghanistan | 18.9 /100 | #205 | Poor 5.4% |
| Immigrants | Brazil | 18.8 /100 | #206 | Poor 5.4% |
| Creek | 15.4 /100 | #207 | Poor 5.4% |
| Immigrants | Costa Rica | 13.7 /100 | #208 | Poor 5.4% |
| Koreans | 13.4 /100 | #209 | Poor 5.4% |
| Choctaw | 12.3 /100 | #210 | Poor 5.4% |
| Ottawa | 11.6 /100 | #211 | Poor 5.4% |
| Uruguayans | 11.4 /100 | #212 | Poor 5.4% |