Immigrants from Canada vs Immigrants from Zimbabwe Female Unemployment
COMPARE
Immigrants from Canada
Immigrants from Zimbabwe
Female Unemployment
Female Unemployment Comparison
Immigrants from Canada
Immigrants from Zimbabwe
4.9%
FEMALE UNEMPLOYMENT
98.6/ 100
METRIC RATING
61st/ 347
METRIC RANK
4.9%
FEMALE UNEMPLOYMENT
99.0/ 100
METRIC RATING
54th/ 347
METRIC RANK
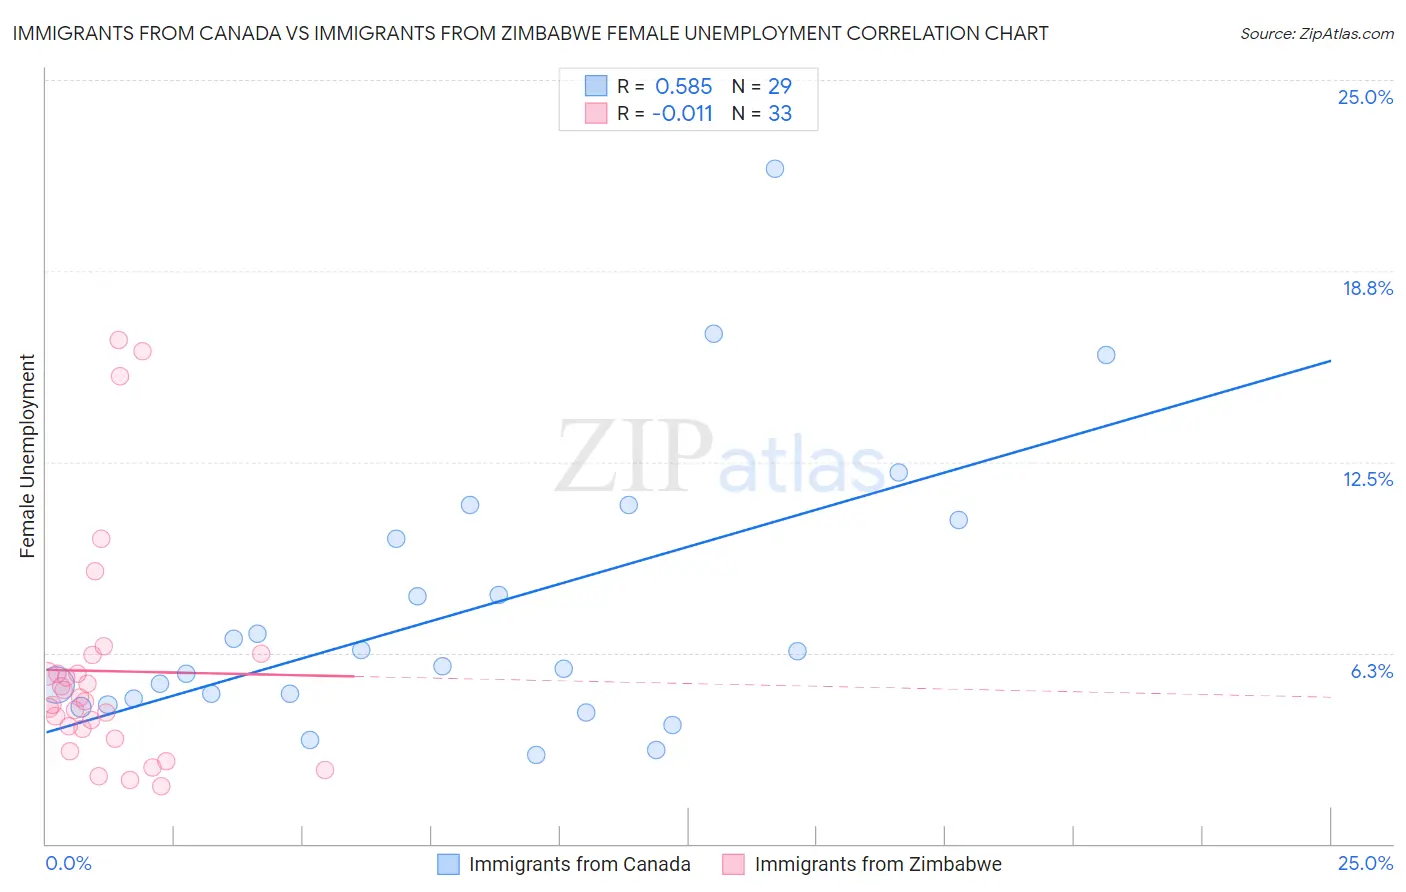
Immigrants from Canada vs Immigrants from Zimbabwe Female Unemployment Correlation Chart
The statistical analysis conducted on geographies consisting of 455,102,288 people shows a substantial positive correlation between the proportion of Immigrants from Canada and unemploymnet rate among females in the United States with a correlation coefficient (R) of 0.585 and weighted average of 4.9%. Similarly, the statistical analysis conducted on geographies consisting of 117,690,630 people shows no correlation between the proportion of Immigrants from Zimbabwe and unemploymnet rate among females in the United States with a correlation coefficient (R) of -0.011 and weighted average of 4.9%, a difference of 0.56%.
Female Unemployment Correlation Summary
| Measurement | Immigrants from Canada | Immigrants from Zimbabwe |
| Minimum | 2.9% | 1.9% |
| Maximum | 22.1% | 16.5% |
| Range | 19.2% | 14.6% |
| Mean | 7.6% | 5.7% |
| Median | 5.8% | 4.7% |
| Interquartile 25% (IQ1) | 4.6% | 3.6% |
| Interquartile 75% (IQ3) | 10.3% | 5.9% |
| Interquartile Range (IQR) | 5.7% | 2.3% |
| Standard Deviation (Sample) | 4.5% | 3.8% |
| Standard Deviation (Population) | 4.5% | 3.7% |
Demographics Similar to Immigrants from Canada and Immigrants from Zimbabwe by Female Unemployment
In terms of female unemployment, the demographic groups most similar to Immigrants from Canada are Immigrants from Nepal (4.9%, a difference of 0.0%), Immigrants from Scotland (4.9%, a difference of 0.010%), Bhutanese (4.9%, a difference of 0.090%), Immigrants from Belgium (4.9%, a difference of 0.12%), and Celtic (4.9%, a difference of 0.12%). Similarly, the demographic groups most similar to Immigrants from Zimbabwe are Immigrants from Moldova (4.9%, a difference of 0.020%), Serbian (4.9%, a difference of 0.030%), White/Caucasian (4.9%, a difference of 0.060%), Slavic (4.9%, a difference of 0.090%), and Cambodian (4.9%, a difference of 0.11%).
| Demographics | Rating | Rank | Female Unemployment |
| Okinawans | 99.3 /100 | #47 | Exceptional 4.9% |
| Thais | 99.2 /100 | #48 | Exceptional 4.9% |
| Australians | 99.2 /100 | #49 | Exceptional 4.9% |
| Immigrants | Cuba | 99.1 /100 | #50 | Exceptional 4.9% |
| Cambodians | 99.1 /100 | #51 | Exceptional 4.9% |
| Slavs | 99.1 /100 | #52 | Exceptional 4.9% |
| Whites/Caucasians | 99.0 /100 | #53 | Exceptional 4.9% |
| Immigrants | Zimbabwe | 99.0 /100 | #54 | Exceptional 4.9% |
| Immigrants | Moldova | 99.0 /100 | #55 | Exceptional 4.9% |
| Serbians | 99.0 /100 | #56 | Exceptional 4.9% |
| Icelanders | 98.8 /100 | #57 | Exceptional 4.9% |
| Immigrants | Lithuania | 98.8 /100 | #58 | Exceptional 4.9% |
| Bhutanese | 98.7 /100 | #59 | Exceptional 4.9% |
| Immigrants | Scotland | 98.6 /100 | #60 | Exceptional 4.9% |
| Immigrants | Canada | 98.6 /100 | #61 | Exceptional 4.9% |
| Immigrants | Nepal | 98.6 /100 | #62 | Exceptional 4.9% |
| Immigrants | Belgium | 98.5 /100 | #63 | Exceptional 4.9% |
| Celtics | 98.5 /100 | #64 | Exceptional 4.9% |
| Immigrants | North America | 98.3 /100 | #65 | Exceptional 4.9% |
| Hungarians | 98.3 /100 | #66 | Exceptional 4.9% |
| Cubans | 98.3 /100 | #67 | Exceptional 4.9% |