Immigrants from Canada vs Hopi Female Unemployment
COMPARE
Immigrants from Canada
Hopi
Female Unemployment
Female Unemployment Comparison
Immigrants from Canada
Hopi
4.9%
FEMALE UNEMPLOYMENT
98.6/ 100
METRIC RATING
61st/ 347
METRIC RANK
8.1%
FEMALE UNEMPLOYMENT
0.0/ 100
METRIC RATING
340th/ 347
METRIC RANK
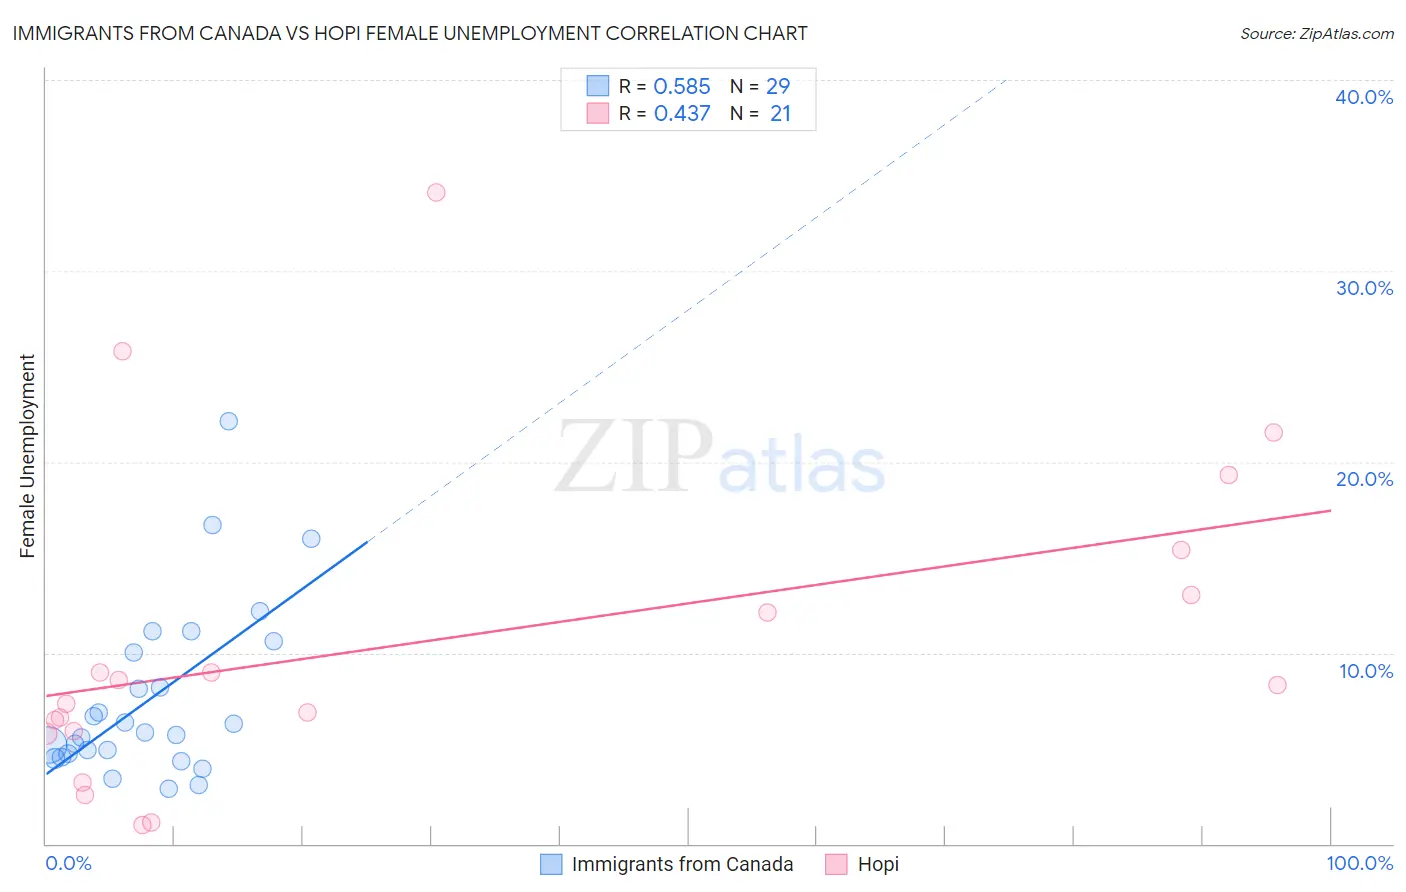
Immigrants from Canada vs Hopi Female Unemployment Correlation Chart
The statistical analysis conducted on geographies consisting of 455,102,288 people shows a substantial positive correlation between the proportion of Immigrants from Canada and unemploymnet rate among females in the United States with a correlation coefficient (R) of 0.585 and weighted average of 4.9%. Similarly, the statistical analysis conducted on geographies consisting of 74,668,306 people shows a moderate positive correlation between the proportion of Hopi and unemploymnet rate among females in the United States with a correlation coefficient (R) of 0.437 and weighted average of 8.1%, a difference of 64.5%.
Female Unemployment Correlation Summary
| Measurement | Immigrants from Canada | Hopi |
| Minimum | 2.9% | 1.0% |
| Maximum | 22.1% | 34.1% |
| Range | 19.2% | 33.1% |
| Mean | 7.6% | 10.6% |
| Median | 5.8% | 8.3% |
| Interquartile 25% (IQ1) | 4.6% | 5.8% |
| Interquartile 75% (IQ3) | 10.3% | 14.2% |
| Interquartile Range (IQR) | 5.7% | 8.4% |
| Standard Deviation (Sample) | 4.5% | 8.5% |
| Standard Deviation (Population) | 4.5% | 8.2% |
Similar Demographics by Female Unemployment
Demographics Similar to Immigrants from Canada by Female Unemployment
In terms of female unemployment, the demographic groups most similar to Immigrants from Canada are Immigrants from Nepal (4.9%, a difference of 0.0%), Immigrants from Scotland (4.9%, a difference of 0.010%), Bhutanese (4.9%, a difference of 0.090%), Immigrants from Belgium (4.9%, a difference of 0.12%), and Celtic (4.9%, a difference of 0.12%).
| Demographics | Rating | Rank | Female Unemployment |
| Immigrants | Zimbabwe | 99.0 /100 | #54 | Exceptional 4.9% |
| Immigrants | Moldova | 99.0 /100 | #55 | Exceptional 4.9% |
| Serbians | 99.0 /100 | #56 | Exceptional 4.9% |
| Icelanders | 98.8 /100 | #57 | Exceptional 4.9% |
| Immigrants | Lithuania | 98.8 /100 | #58 | Exceptional 4.9% |
| Bhutanese | 98.7 /100 | #59 | Exceptional 4.9% |
| Immigrants | Scotland | 98.6 /100 | #60 | Exceptional 4.9% |
| Immigrants | Canada | 98.6 /100 | #61 | Exceptional 4.9% |
| Immigrants | Nepal | 98.6 /100 | #62 | Exceptional 4.9% |
| Immigrants | Belgium | 98.5 /100 | #63 | Exceptional 4.9% |
| Celtics | 98.5 /100 | #64 | Exceptional 4.9% |
| Immigrants | North America | 98.3 /100 | #65 | Exceptional 4.9% |
| Hungarians | 98.3 /100 | #66 | Exceptional 4.9% |
| Cubans | 98.3 /100 | #67 | Exceptional 4.9% |
| Tlingit-Haida | 98.3 /100 | #68 | Exceptional 4.9% |
Demographics Similar to Hopi by Female Unemployment
In terms of female unemployment, the demographic groups most similar to Hopi are Inupiat (8.2%, a difference of 0.76%), Puerto Rican (8.3%, a difference of 3.0%), Immigrants from Yemen (7.8%, a difference of 3.3%), Tohono O'odham (7.7%, a difference of 4.5%), and Arapaho (8.8%, a difference of 8.6%).
| Demographics | Rating | Rank | Female Unemployment |
| Menominee | 0.0 /100 | #333 | Tragic 7.0% |
| Immigrants | Armenia | 0.0 /100 | #334 | Tragic 7.1% |
| Dominicans | 0.0 /100 | #335 | Tragic 7.2% |
| Immigrants | Dominican Republic | 0.0 /100 | #336 | Tragic 7.2% |
| Navajo | 0.0 /100 | #337 | Tragic 7.3% |
| Tohono O'odham | 0.0 /100 | #338 | Tragic 7.7% |
| Immigrants | Yemen | 0.0 /100 | #339 | Tragic 7.8% |
| Hopi | 0.0 /100 | #340 | Tragic 8.1% |
| Inupiat | 0.0 /100 | #341 | Tragic 8.2% |
| Puerto Ricans | 0.0 /100 | #342 | Tragic 8.3% |
| Arapaho | 0.0 /100 | #343 | Tragic 8.8% |
| Pima | 0.0 /100 | #344 | Tragic 9.3% |
| Yuman | 0.0 /100 | #345 | Tragic 9.6% |
| Yup'ik | 0.0 /100 | #346 | Tragic 10.9% |
| Crow | 0.0 /100 | #347 | Tragic 12.1% |