Immigrants from Burma/Myanmar vs Immigrants from Cuba Unemployment Among Seniors over 75 years
COMPARE
Immigrants from Burma/Myanmar
Immigrants from Cuba
Unemployment Among Seniors over 75 years
Unemployment Among Seniors over 75 years Comparison
Immigrants from Burma/Myanmar
Immigrants from Cuba
7.7%
UNEMPLOYMENT AMONG SENIORS OVER 75 YEARS
100.0/ 100
METRIC RATING
41st/ 347
METRIC RANK
7.4%
UNEMPLOYMENT AMONG SENIORS OVER 75 YEARS
100.0/ 100
METRIC RATING
24th/ 347
METRIC RANK
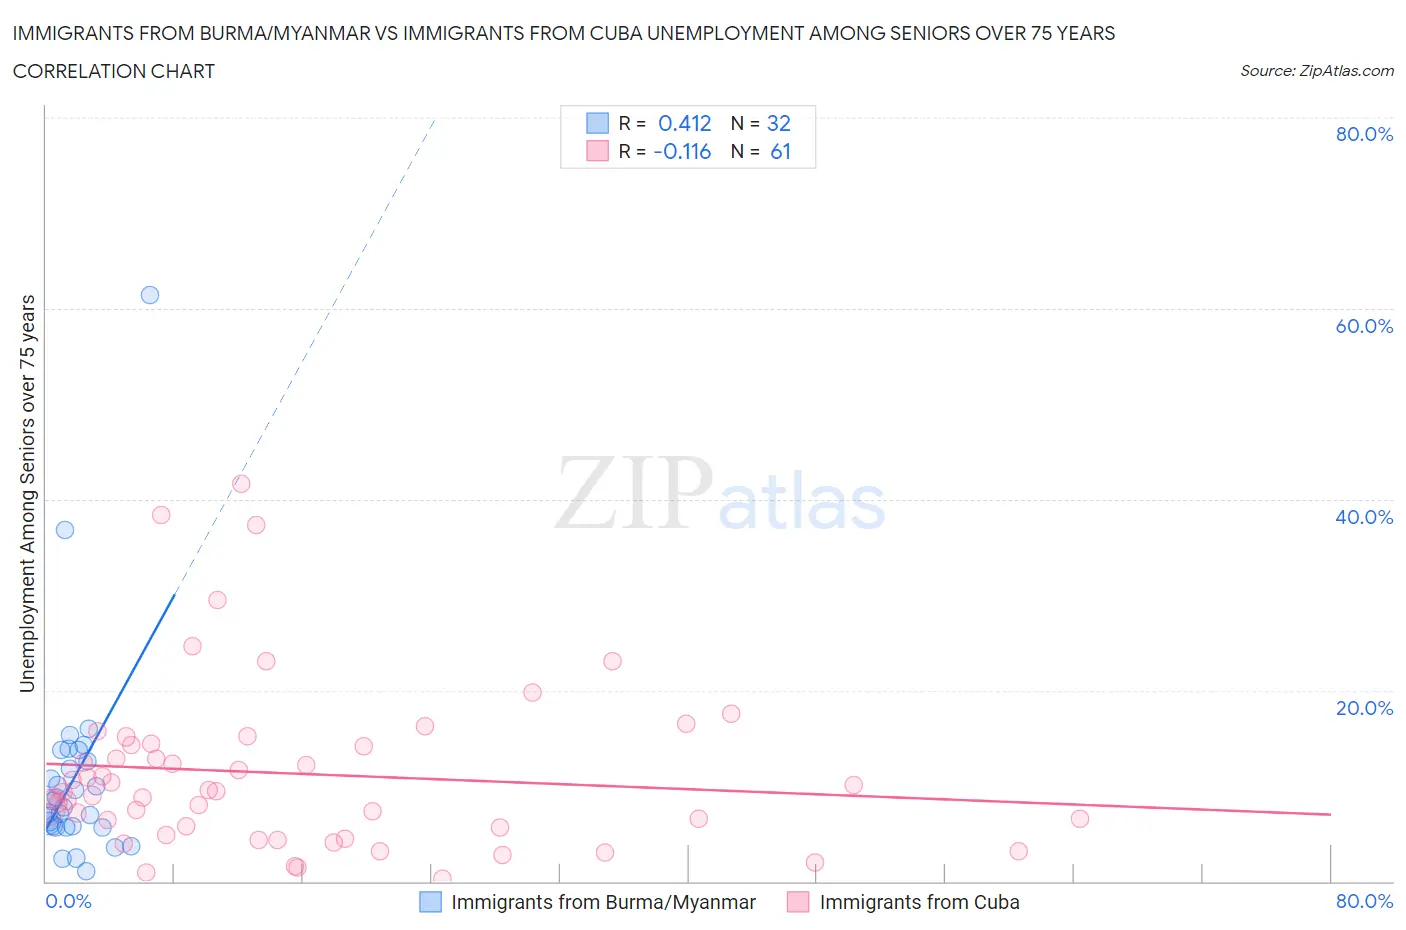
Immigrants from Burma/Myanmar vs Immigrants from Cuba Unemployment Among Seniors over 75 years Correlation Chart
The statistical analysis conducted on geographies consisting of 114,707,279 people shows a moderate positive correlation between the proportion of Immigrants from Burma/Myanmar and unemployment rate among seniors over the age of 75 in the United States with a correlation coefficient (R) of 0.412 and weighted average of 7.7%. Similarly, the statistical analysis conducted on geographies consisting of 178,826,152 people shows a poor negative correlation between the proportion of Immigrants from Cuba and unemployment rate among seniors over the age of 75 in the United States with a correlation coefficient (R) of -0.116 and weighted average of 7.4%, a difference of 3.9%.
Unemployment Among Seniors over 75 years Correlation Summary
| Measurement | Immigrants from Burma/Myanmar | Immigrants from Cuba |
| Minimum | 1.1% | 0.20% |
| Maximum | 61.4% | 41.7% |
| Range | 60.3% | 41.5% |
| Mean | 10.9% | 11.3% |
| Median | 8.1% | 9.3% |
| Interquartile 25% (IQ1) | 5.7% | 5.2% |
| Interquartile 75% (IQ3) | 13.2% | 14.3% |
| Interquartile Range (IQR) | 7.5% | 9.1% |
| Standard Deviation (Sample) | 11.2% | 8.8% |
| Standard Deviation (Population) | 11.0% | 8.8% |
Demographics Similar to Immigrants from Burma/Myanmar and Immigrants from Cuba by Unemployment Among Seniors over 75 years
In terms of unemployment among seniors over 75 years, the demographic groups most similar to Immigrants from Burma/Myanmar are Colville (7.7%, a difference of 0.13%), Ugandan (7.7%, a difference of 0.16%), Kiowa (7.7%, a difference of 0.20%), Immigrants from Hungary (7.7%, a difference of 0.21%), and Pueblo (7.7%, a difference of 0.23%). Similarly, the demographic groups most similar to Immigrants from Cuba are Israeli (7.4%, a difference of 0.080%), Cypriot (7.4%, a difference of 0.41%), Immigrants from Uruguay (7.5%, a difference of 1.1%), South African (7.5%, a difference of 1.3%), and Immigrants from Barbados (7.6%, a difference of 1.8%).
| Demographics | Rating | Rank | Unemployment Among Seniors over 75 years |
| Cypriots | 100.0 /100 | #22 | Exceptional 7.4% |
| Israelis | 100.0 /100 | #23 | Exceptional 7.4% |
| Immigrants | Cuba | 100.0 /100 | #24 | Exceptional 7.4% |
| Immigrants | Uruguay | 100.0 /100 | #25 | Exceptional 7.5% |
| South Africans | 100.0 /100 | #26 | Exceptional 7.5% |
| Immigrants | Barbados | 100.0 /100 | #27 | Exceptional 7.6% |
| Immigrants | Israel | 100.0 /100 | #28 | Exceptional 7.6% |
| Immigrants | Iran | 100.0 /100 | #29 | Exceptional 7.6% |
| Immigrants | Sweden | 100.0 /100 | #30 | Exceptional 7.6% |
| Guyanese | 100.0 /100 | #31 | Exceptional 7.6% |
| Immigrants | Hong Kong | 100.0 /100 | #32 | Exceptional 7.6% |
| Cambodians | 100.0 /100 | #33 | Exceptional 7.6% |
| Immigrants | Eritrea | 100.0 /100 | #34 | Exceptional 7.7% |
| Immigrants | Norway | 100.0 /100 | #35 | Exceptional 7.7% |
| Luxembourgers | 100.0 /100 | #36 | Exceptional 7.7% |
| Immigrants | Hungary | 100.0 /100 | #37 | Exceptional 7.7% |
| Kiowa | 100.0 /100 | #38 | Exceptional 7.7% |
| Ugandans | 100.0 /100 | #39 | Exceptional 7.7% |
| Colville | 100.0 /100 | #40 | Exceptional 7.7% |
| Immigrants | Burma/Myanmar | 100.0 /100 | #41 | Exceptional 7.7% |
| Pueblo | 100.0 /100 | #42 | Exceptional 7.7% |