Immigrants from Burma/Myanmar vs Welsh Unemployment Among Seniors over 75 years
COMPARE
Immigrants from Burma/Myanmar
Welsh
Unemployment Among Seniors over 75 years
Unemployment Among Seniors over 75 years Comparison
Immigrants from Burma/Myanmar
Welsh
7.7%
UNEMPLOYMENT AMONG SENIORS OVER 75 YEARS
100.0/ 100
METRIC RATING
41st/ 347
METRIC RANK
10.0%
UNEMPLOYMENT AMONG SENIORS OVER 75 YEARS
0.0/ 100
METRIC RATING
301st/ 347
METRIC RANK
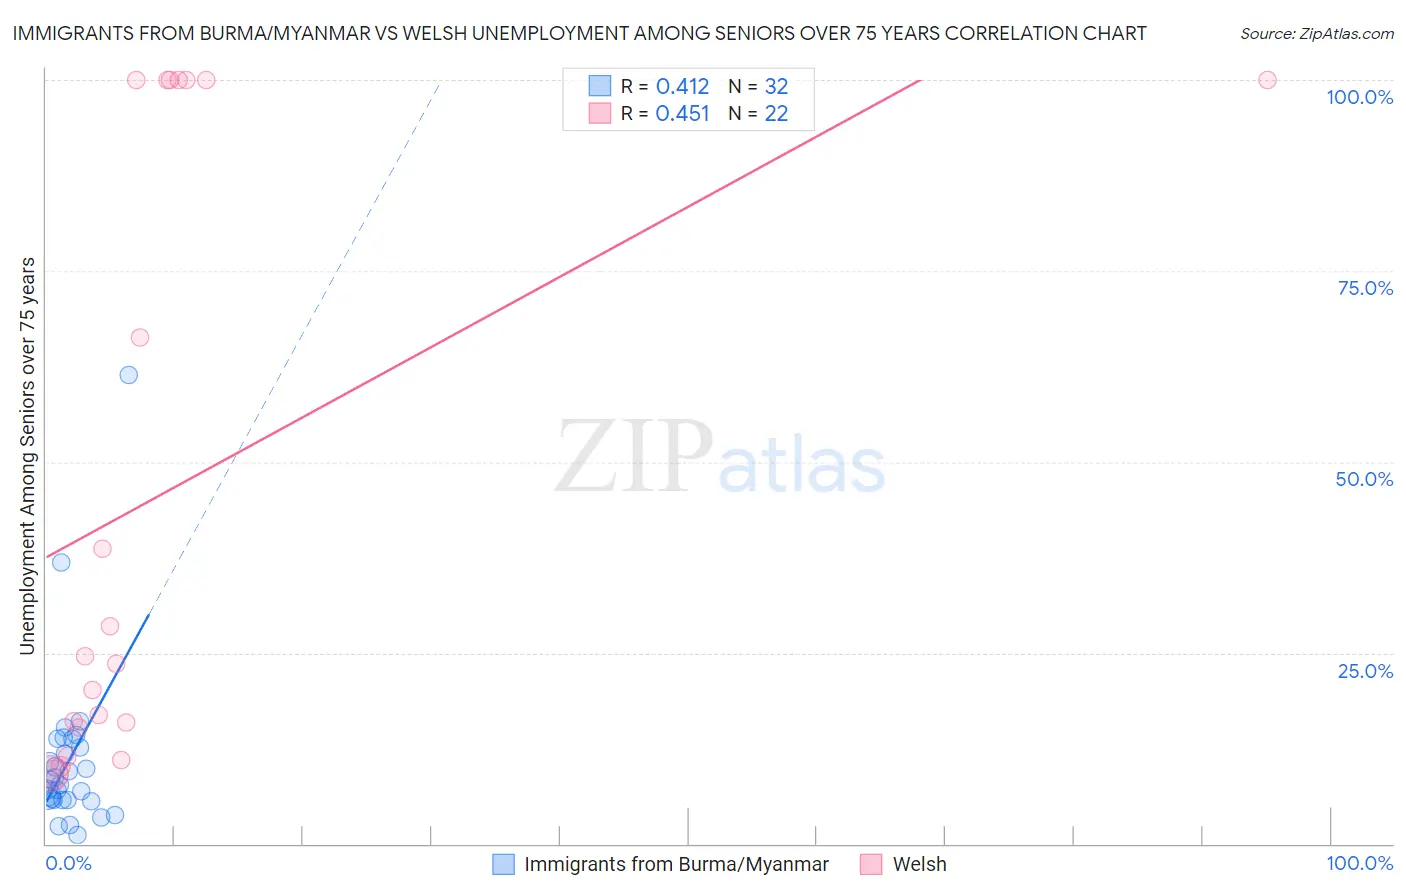
Immigrants from Burma/Myanmar vs Welsh Unemployment Among Seniors over 75 years Correlation Chart
The statistical analysis conducted on geographies consisting of 114,707,279 people shows a moderate positive correlation between the proportion of Immigrants from Burma/Myanmar and unemployment rate among seniors over the age of 75 in the United States with a correlation coefficient (R) of 0.412 and weighted average of 7.7%. Similarly, the statistical analysis conducted on geographies consisting of 226,491,024 people shows a moderate positive correlation between the proportion of Welsh and unemployment rate among seniors over the age of 75 in the United States with a correlation coefficient (R) of 0.451 and weighted average of 10.0%, a difference of 28.9%.
Unemployment Among Seniors over 75 years Correlation Summary
| Measurement | Immigrants from Burma/Myanmar | Welsh |
| Minimum | 1.1% | 9.1% |
| Maximum | 61.4% | 100.0% |
| Range | 60.3% | 90.9% |
| Mean | 10.9% | 46.2% |
| Median | 8.1% | 24.1% |
| Interquartile 25% (IQ1) | 5.7% | 15.2% |
| Interquartile 75% (IQ3) | 13.2% | 100.0% |
| Interquartile Range (IQR) | 7.5% | 84.8% |
| Standard Deviation (Sample) | 11.2% | 39.6% |
| Standard Deviation (Population) | 11.0% | 38.6% |
Similar Demographics by Unemployment Among Seniors over 75 years
Demographics Similar to Immigrants from Burma/Myanmar by Unemployment Among Seniors over 75 years
In terms of unemployment among seniors over 75 years, the demographic groups most similar to Immigrants from Burma/Myanmar are Colville (7.7%, a difference of 0.13%), Ugandan (7.7%, a difference of 0.16%), Kiowa (7.7%, a difference of 0.20%), Immigrants from Hungary (7.7%, a difference of 0.21%), and Pueblo (7.7%, a difference of 0.23%).
| Demographics | Rating | Rank | Unemployment Among Seniors over 75 years |
| Immigrants | Eritrea | 100.0 /100 | #34 | Exceptional 7.7% |
| Immigrants | Norway | 100.0 /100 | #35 | Exceptional 7.7% |
| Luxembourgers | 100.0 /100 | #36 | Exceptional 7.7% |
| Immigrants | Hungary | 100.0 /100 | #37 | Exceptional 7.7% |
| Kiowa | 100.0 /100 | #38 | Exceptional 7.7% |
| Ugandans | 100.0 /100 | #39 | Exceptional 7.7% |
| Colville | 100.0 /100 | #40 | Exceptional 7.7% |
| Immigrants | Burma/Myanmar | 100.0 /100 | #41 | Exceptional 7.7% |
| Pueblo | 100.0 /100 | #42 | Exceptional 7.7% |
| Immigrants | Denmark | 100.0 /100 | #43 | Exceptional 7.8% |
| Immigrants | Spain | 100.0 /100 | #44 | Exceptional 7.8% |
| British West Indians | 100.0 /100 | #45 | Exceptional 7.8% |
| Immigrants | China | 100.0 /100 | #46 | Exceptional 7.8% |
| Creek | 100.0 /100 | #47 | Exceptional 7.8% |
| Immigrants | Chile | 100.0 /100 | #48 | Exceptional 7.8% |
Demographics Similar to Welsh by Unemployment Among Seniors over 75 years
In terms of unemployment among seniors over 75 years, the demographic groups most similar to Welsh are Finnish (10.0%, a difference of 0.11%), Puget Sound Salish (10.0%, a difference of 0.18%), Scotch-Irish (10.0%, a difference of 0.19%), Swedish (10.0%, a difference of 0.38%), and Iraqi (9.9%, a difference of 0.42%).
| Demographics | Rating | Rank | Unemployment Among Seniors over 75 years |
| Immigrants | Dominica | 0.0 /100 | #294 | Tragic 9.8% |
| Immigrants | Nonimmigrants | 0.0 /100 | #295 | Tragic 9.8% |
| Immigrants | St. Vincent and the Grenadines | 0.0 /100 | #296 | Tragic 9.8% |
| Cherokee | 0.0 /100 | #297 | Tragic 9.8% |
| Lithuanians | 0.0 /100 | #298 | Tragic 9.9% |
| Belgians | 0.0 /100 | #299 | Tragic 9.9% |
| Iraqis | 0.0 /100 | #300 | Tragic 9.9% |
| Welsh | 0.0 /100 | #301 | Tragic 10.0% |
| Finns | 0.0 /100 | #302 | Tragic 10.0% |
| Puget Sound Salish | 0.0 /100 | #303 | Tragic 10.0% |
| Scotch-Irish | 0.0 /100 | #304 | Tragic 10.0% |
| Swedes | 0.0 /100 | #305 | Tragic 10.0% |
| Italians | 0.0 /100 | #306 | Tragic 10.0% |
| Immigrants | Fiji | 0.0 /100 | #307 | Tragic 10.0% |
| Whites/Caucasians | 0.0 /100 | #308 | Tragic 10.1% |