Immigrants from Burma/Myanmar vs Albanian Disability Age 18 to 34
COMPARE
Immigrants from Burma/Myanmar
Albanian
Disability Age 18 to 34
Disability Age 18 to 34 Comparison
Immigrants from Burma/Myanmar
Albanians
6.8%
DISABILITY AGE 18 TO 34
12.3/ 100
METRIC RATING
209th/ 347
METRIC RANK
6.4%
DISABILITY AGE 18 TO 34
85.3/ 100
METRIC RATING
144th/ 347
METRIC RANK
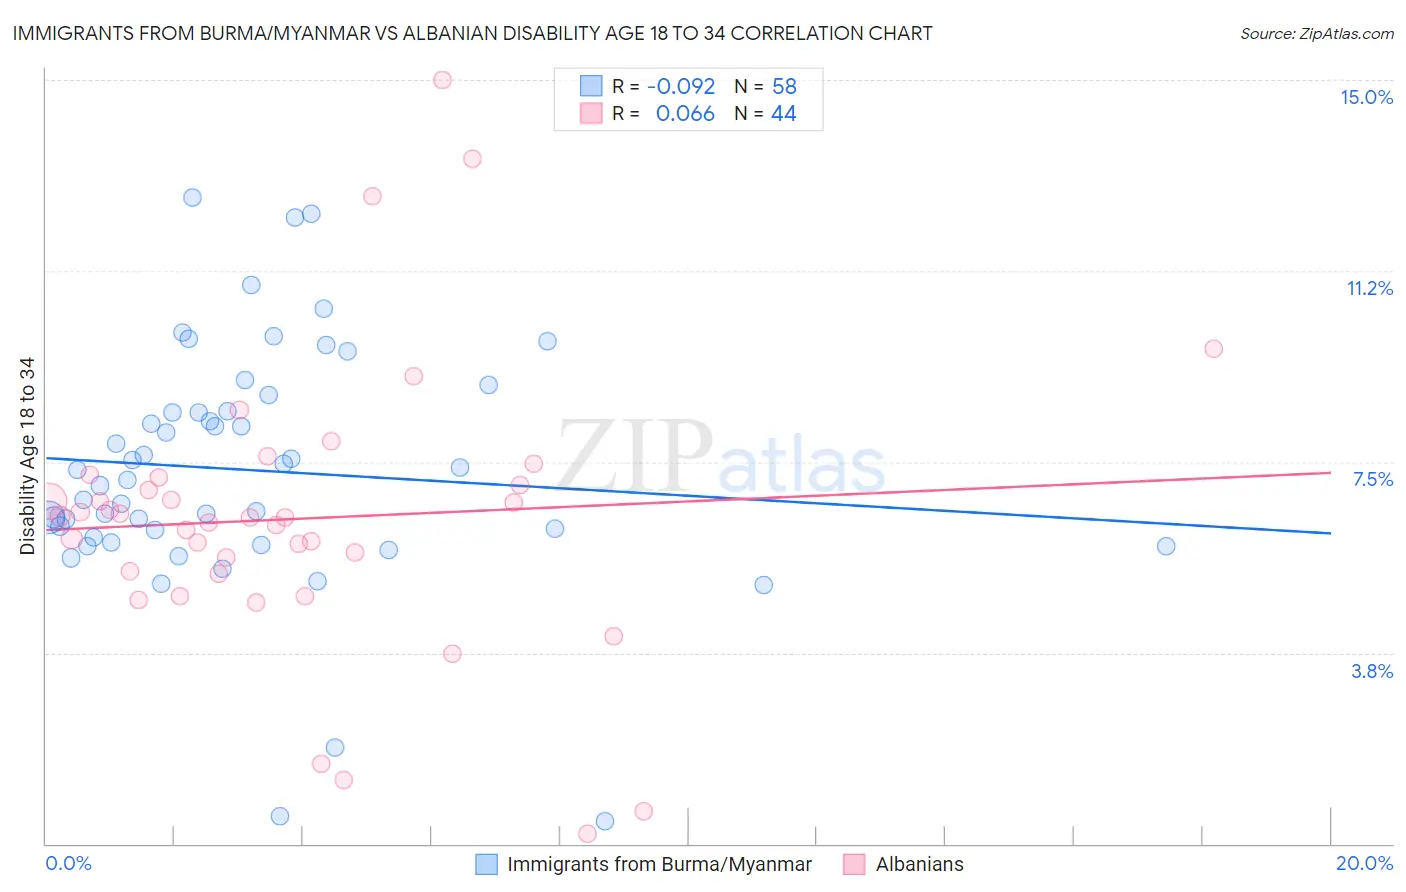
Immigrants from Burma/Myanmar vs Albanian Disability Age 18 to 34 Correlation Chart
The statistical analysis conducted on geographies consisting of 172,278,833 people shows a slight negative correlation between the proportion of Immigrants from Burma/Myanmar and percentage of population with a disability between the ages 18 and 35 in the United States with a correlation coefficient (R) of -0.092 and weighted average of 6.8%. Similarly, the statistical analysis conducted on geographies consisting of 192,986,276 people shows a slight positive correlation between the proportion of Albanians and percentage of population with a disability between the ages 18 and 35 in the United States with a correlation coefficient (R) of 0.066 and weighted average of 6.4%, a difference of 6.7%.
Disability Age 18 to 34 Correlation Summary
| Measurement | Immigrants from Burma/Myanmar | Albanian |
| Minimum | 0.44% | 0.20% |
| Maximum | 12.7% | 15.0% |
| Range | 12.2% | 14.8% |
| Mean | 7.3% | 6.4% |
| Median | 7.2% | 6.4% |
| Interquartile 25% (IQ1) | 6.0% | 5.3% |
| Interquartile 75% (IQ3) | 8.5% | 7.1% |
| Interquartile Range (IQR) | 2.5% | 1.8% |
| Standard Deviation (Sample) | 2.4% | 2.8% |
| Standard Deviation (Population) | 2.4% | 2.8% |
Similar Demographics by Disability Age 18 to 34
Demographics Similar to Immigrants from Burma/Myanmar by Disability Age 18 to 34
In terms of disability age 18 to 34, the demographic groups most similar to Immigrants from Burma/Myanmar are Immigrants from Scotland (6.8%, a difference of 0.020%), Mexican (6.8%, a difference of 0.040%), Japanese (6.8%, a difference of 0.080%), Lebanese (6.8%, a difference of 0.15%), and Immigrants from Bosnia and Herzegovina (6.8%, a difference of 0.20%).
| Demographics | Rating | Rank | Disability Age 18 to 34 |
| Panamanians | 15.8 /100 | #202 | Poor 6.8% |
| Hispanics or Latinos | 13.8 /100 | #203 | Poor 6.8% |
| Immigrants | Bosnia and Herzegovina | 13.6 /100 | #204 | Poor 6.8% |
| Lebanese | 13.3 /100 | #205 | Poor 6.8% |
| Japanese | 12.8 /100 | #206 | Poor 6.8% |
| Mexicans | 12.6 /100 | #207 | Poor 6.8% |
| Immigrants | Scotland | 12.4 /100 | #208 | Poor 6.8% |
| Immigrants | Burma/Myanmar | 12.3 /100 | #209 | Poor 6.8% |
| Latvians | 11.1 /100 | #210 | Poor 6.8% |
| Immigrants | Norway | 10.0 /100 | #211 | Tragic 6.8% |
| Luxembourgers | 9.4 /100 | #212 | Tragic 6.9% |
| Immigrants | Western Europe | 9.1 /100 | #213 | Tragic 6.9% |
| Serbians | 8.2 /100 | #214 | Tragic 6.9% |
| Immigrants | Thailand | 7.5 /100 | #215 | Tragic 6.9% |
| Sudanese | 7.0 /100 | #216 | Tragic 6.9% |
Demographics Similar to Albanians by Disability Age 18 to 34
In terms of disability age 18 to 34, the demographic groups most similar to Albanians are Moroccan (6.4%, a difference of 0.0%), Belizean (6.4%, a difference of 0.060%), Immigrants from Latvia (6.4%, a difference of 0.17%), South American Indian (6.4%, a difference of 0.19%), and Jamaican (6.4%, a difference of 0.22%).
| Demographics | Rating | Rank | Disability Age 18 to 34 |
| Immigrants | Honduras | 87.7 /100 | #137 | Excellent 6.4% |
| Spanish American Indians | 87.7 /100 | #138 | Excellent 6.4% |
| Immigrants | Belize | 87.4 /100 | #139 | Excellent 6.4% |
| Immigrants | Fiji | 87.3 /100 | #140 | Excellent 6.4% |
| Jamaicans | 86.8 /100 | #141 | Excellent 6.4% |
| South American Indians | 86.5 /100 | #142 | Excellent 6.4% |
| Immigrants | Latvia | 86.4 /100 | #143 | Excellent 6.4% |
| Albanians | 85.3 /100 | #144 | Excellent 6.4% |
| Moroccans | 85.2 /100 | #145 | Excellent 6.4% |
| Belizeans | 84.9 /100 | #146 | Excellent 6.4% |
| Immigrants | South Africa | 83.7 /100 | #147 | Excellent 6.4% |
| Immigrants | Belgium | 83.5 /100 | #148 | Excellent 6.4% |
| Hondurans | 83.1 /100 | #149 | Excellent 6.4% |
| Immigrants | Dominican Republic | 82.7 /100 | #150 | Excellent 6.4% |
| Tongans | 81.9 /100 | #151 | Excellent 6.4% |