Immigrants from Burma/Myanmar vs Brazilian Unemployment Among Seniors over 75 years
COMPARE
Immigrants from Burma/Myanmar
Brazilian
Unemployment Among Seniors over 75 years
Unemployment Among Seniors over 75 years Comparison
Immigrants from Burma/Myanmar
Brazilians
7.7%
UNEMPLOYMENT AMONG SENIORS OVER 75 YEARS
100.0/ 100
METRIC RATING
41st/ 347
METRIC RANK
9.3%
UNEMPLOYMENT AMONG SENIORS OVER 75 YEARS
1.3/ 100
METRIC RATING
256th/ 347
METRIC RANK
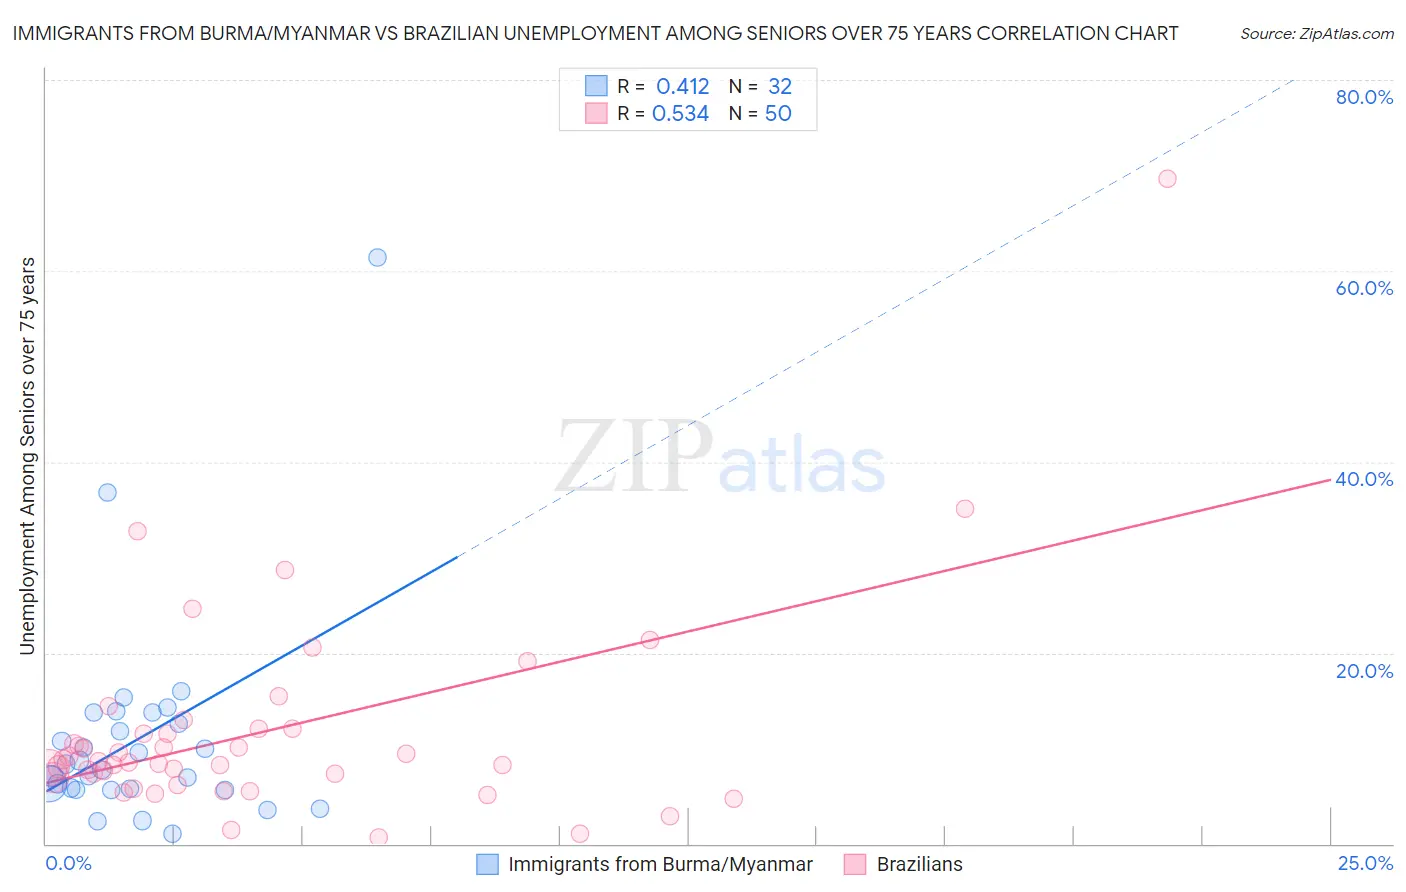
Immigrants from Burma/Myanmar vs Brazilian Unemployment Among Seniors over 75 years Correlation Chart
The statistical analysis conducted on geographies consisting of 114,707,279 people shows a moderate positive correlation between the proportion of Immigrants from Burma/Myanmar and unemployment rate among seniors over the age of 75 in the United States with a correlation coefficient (R) of 0.412 and weighted average of 7.7%. Similarly, the statistical analysis conducted on geographies consisting of 180,359,219 people shows a substantial positive correlation between the proportion of Brazilians and unemployment rate among seniors over the age of 75 in the United States with a correlation coefficient (R) of 0.534 and weighted average of 9.3%, a difference of 19.8%.
Unemployment Among Seniors over 75 years Correlation Summary
| Measurement | Immigrants from Burma/Myanmar | Brazilian |
| Minimum | 1.1% | 0.60% |
| Maximum | 61.4% | 69.7% |
| Range | 60.3% | 69.1% |
| Mean | 10.9% | 11.8% |
| Median | 8.1% | 8.6% |
| Interquartile 25% (IQ1) | 5.7% | 6.9% |
| Interquartile 75% (IQ3) | 13.2% | 12.0% |
| Interquartile Range (IQR) | 7.5% | 5.1% |
| Standard Deviation (Sample) | 11.2% | 11.1% |
| Standard Deviation (Population) | 11.0% | 11.0% |
Similar Demographics by Unemployment Among Seniors over 75 years
Demographics Similar to Immigrants from Burma/Myanmar by Unemployment Among Seniors over 75 years
In terms of unemployment among seniors over 75 years, the demographic groups most similar to Immigrants from Burma/Myanmar are Colville (7.7%, a difference of 0.13%), Ugandan (7.7%, a difference of 0.16%), Kiowa (7.7%, a difference of 0.20%), Immigrants from Hungary (7.7%, a difference of 0.21%), and Pueblo (7.7%, a difference of 0.23%).
| Demographics | Rating | Rank | Unemployment Among Seniors over 75 years |
| Immigrants | Eritrea | 100.0 /100 | #34 | Exceptional 7.7% |
| Immigrants | Norway | 100.0 /100 | #35 | Exceptional 7.7% |
| Luxembourgers | 100.0 /100 | #36 | Exceptional 7.7% |
| Immigrants | Hungary | 100.0 /100 | #37 | Exceptional 7.7% |
| Kiowa | 100.0 /100 | #38 | Exceptional 7.7% |
| Ugandans | 100.0 /100 | #39 | Exceptional 7.7% |
| Colville | 100.0 /100 | #40 | Exceptional 7.7% |
| Immigrants | Burma/Myanmar | 100.0 /100 | #41 | Exceptional 7.7% |
| Pueblo | 100.0 /100 | #42 | Exceptional 7.7% |
| Immigrants | Denmark | 100.0 /100 | #43 | Exceptional 7.8% |
| Immigrants | Spain | 100.0 /100 | #44 | Exceptional 7.8% |
| British West Indians | 100.0 /100 | #45 | Exceptional 7.8% |
| Immigrants | China | 100.0 /100 | #46 | Exceptional 7.8% |
| Creek | 100.0 /100 | #47 | Exceptional 7.8% |
| Immigrants | Chile | 100.0 /100 | #48 | Exceptional 7.8% |
Demographics Similar to Brazilians by Unemployment Among Seniors over 75 years
In terms of unemployment among seniors over 75 years, the demographic groups most similar to Brazilians are Hawaiian (9.3%, a difference of 0.12%), Immigrants from Scotland (9.2%, a difference of 0.15%), Immigrants from England (9.3%, a difference of 0.27%), Slovene (9.3%, a difference of 0.28%), and Immigrants from Cameroon (9.3%, a difference of 0.33%).
| Demographics | Rating | Rank | Unemployment Among Seniors over 75 years |
| Immigrants | Saudi Arabia | 2.2 /100 | #249 | Tragic 9.2% |
| Central American Indians | 2.2 /100 | #250 | Tragic 9.2% |
| Immigrants | Poland | 2.0 /100 | #251 | Tragic 9.2% |
| Immigrants | Sudan | 2.0 /100 | #252 | Tragic 9.2% |
| Pima | 1.8 /100 | #253 | Tragic 9.2% |
| Immigrants | Ghana | 1.7 /100 | #254 | Tragic 9.2% |
| Immigrants | Scotland | 1.4 /100 | #255 | Tragic 9.2% |
| Brazilians | 1.3 /100 | #256 | Tragic 9.3% |
| Hawaiians | 1.2 /100 | #257 | Tragic 9.3% |
| Immigrants | England | 1.0 /100 | #258 | Tragic 9.3% |
| Slovenes | 1.0 /100 | #259 | Tragic 9.3% |
| Immigrants | Cameroon | 1.0 /100 | #260 | Tragic 9.3% |
| Celtics | 0.8 /100 | #261 | Tragic 9.3% |
| Austrians | 0.7 /100 | #262 | Tragic 9.3% |
| Ukrainians | 0.7 /100 | #263 | Tragic 9.3% |