Immigrants from Barbados vs Spanish Unemployment Among Women with Children Ages 6 to 17 years
COMPARE
Immigrants from Barbados
Spanish
Unemployment Among Women with Children Ages 6 to 17 years
Unemployment Among Women with Children Ages 6 to 17 years Comparison
Immigrants from Barbados
Spanish
8.5%
UNEMPLOYMENT AMONG WOMEN WITH CHILDREN AGES 6 TO 17 YEARS
98.8/ 100
METRIC RATING
94th/ 347
METRIC RANK
8.9%
UNEMPLOYMENT AMONG WOMEN WITH CHILDREN AGES 6 TO 17 YEARS
63.8/ 100
METRIC RATING
159th/ 347
METRIC RANK
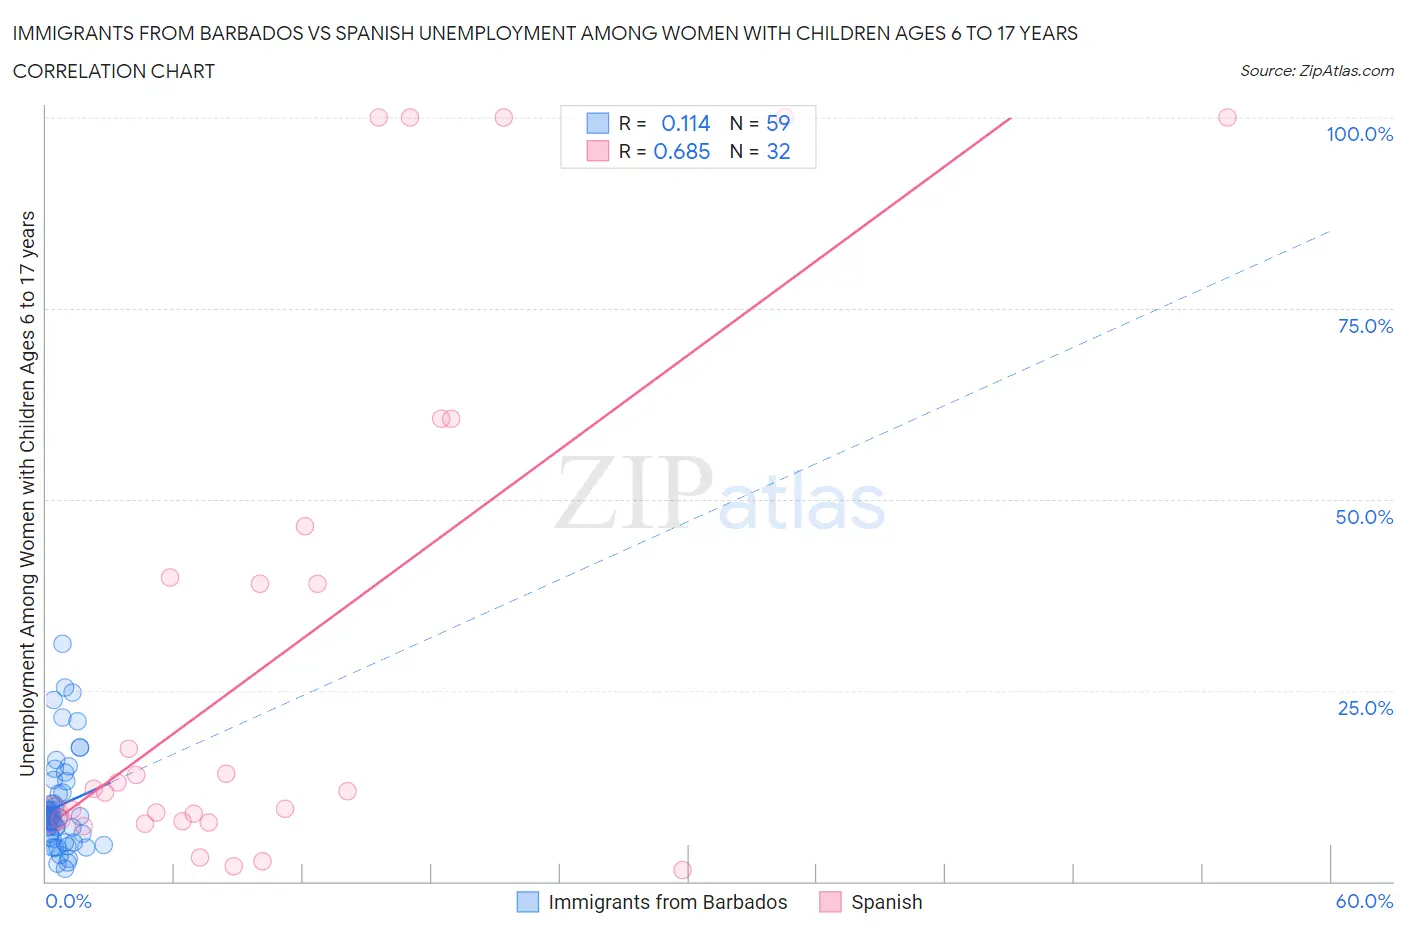
Immigrants from Barbados vs Spanish Unemployment Among Women with Children Ages 6 to 17 years Correlation Chart
The statistical analysis conducted on geographies consisting of 98,607,035 people shows a poor positive correlation between the proportion of Immigrants from Barbados and unemployment rate among women with children between the ages 6 and 17 in the United States with a correlation coefficient (R) of 0.114 and weighted average of 8.5%. Similarly, the statistical analysis conducted on geographies consisting of 298,620,036 people shows a significant positive correlation between the proportion of Spanish and unemployment rate among women with children between the ages 6 and 17 in the United States with a correlation coefficient (R) of 0.685 and weighted average of 8.9%, a difference of 4.4%.
Unemployment Among Women with Children Ages 6 to 17 years Correlation Summary
| Measurement | Immigrants from Barbados | Spanish |
| Minimum | 1.6% | 1.4% |
| Maximum | 31.1% | 100.0% |
| Range | 29.5% | 98.6% |
| Mean | 9.9% | 30.4% |
| Median | 8.5% | 11.9% |
| Interquartile 25% (IQ1) | 5.7% | 8.0% |
| Interquartile 75% (IQ3) | 11.7% | 43.2% |
| Interquartile Range (IQR) | 6.0% | 35.2% |
| Standard Deviation (Sample) | 6.2% | 34.4% |
| Standard Deviation (Population) | 6.2% | 33.8% |
Similar Demographics by Unemployment Among Women with Children Ages 6 to 17 years
Demographics Similar to Immigrants from Barbados by Unemployment Among Women with Children Ages 6 to 17 years
In terms of unemployment among women with children ages 6 to 17 years, the demographic groups most similar to Immigrants from Barbados are Sri Lankan (8.5%, a difference of 0.060%), Australian (8.5%, a difference of 0.11%), German Russian (8.5%, a difference of 0.12%), Bolivian (8.5%, a difference of 0.21%), and Potawatomi (8.5%, a difference of 0.23%).
| Demographics | Rating | Rank | Unemployment Among Women with Children Ages 6 to 17 years |
| Immigrants | Israel | 99.1 /100 | #87 | Exceptional 8.5% |
| Immigrants | Vietnam | 99.1 /100 | #88 | Exceptional 8.5% |
| Paiute | 99.1 /100 | #89 | Exceptional 8.5% |
| Yugoslavians | 99.0 /100 | #90 | Exceptional 8.5% |
| Immigrants | Eastern Europe | 99.0 /100 | #91 | Exceptional 8.5% |
| Potawatomi | 99.0 /100 | #92 | Exceptional 8.5% |
| Australians | 98.9 /100 | #93 | Exceptional 8.5% |
| Immigrants | Barbados | 98.8 /100 | #94 | Exceptional 8.5% |
| Sri Lankans | 98.7 /100 | #95 | Exceptional 8.5% |
| German Russians | 98.6 /100 | #96 | Exceptional 8.5% |
| Bolivians | 98.5 /100 | #97 | Exceptional 8.5% |
| Malaysians | 98.5 /100 | #98 | Exceptional 8.6% |
| Immigrants | Lithuania | 98.4 /100 | #99 | Exceptional 8.6% |
| New Zealanders | 98.4 /100 | #100 | Exceptional 8.6% |
| Immigrants | Pakistan | 98.4 /100 | #101 | Exceptional 8.6% |
Demographics Similar to Spanish by Unemployment Among Women with Children Ages 6 to 17 years
In terms of unemployment among women with children ages 6 to 17 years, the demographic groups most similar to Spanish are Immigrants from Hungary (8.9%, a difference of 0.020%), Immigrants from Guyana (8.9%, a difference of 0.040%), Immigrants from Chile (8.9%, a difference of 0.070%), Immigrants from Belgium (8.9%, a difference of 0.090%), and Osage (8.9%, a difference of 0.10%).
| Demographics | Rating | Rank | Unemployment Among Women with Children Ages 6 to 17 years |
| Immigrants | Northern Europe | 74.6 /100 | #152 | Good 8.9% |
| Immigrants | Europe | 73.4 /100 | #153 | Good 8.9% |
| Vietnamese | 72.1 /100 | #154 | Good 8.9% |
| Immigrants | Greece | 71.8 /100 | #155 | Good 8.9% |
| Osage | 65.9 /100 | #156 | Good 8.9% |
| Immigrants | Belgium | 65.6 /100 | #157 | Good 8.9% |
| Immigrants | Chile | 65.3 /100 | #158 | Good 8.9% |
| Spanish | 63.8 /100 | #159 | Good 8.9% |
| Immigrants | Hungary | 63.4 /100 | #160 | Good 8.9% |
| Immigrants | Guyana | 63.0 /100 | #161 | Good 8.9% |
| Immigrants | Netherlands | 60.8 /100 | #162 | Good 8.9% |
| Mexican American Indians | 60.6 /100 | #163 | Good 8.9% |
| Ukrainians | 59.7 /100 | #164 | Average 8.9% |
| Immigrants | Micronesia | 59.2 /100 | #165 | Average 8.9% |
| Moroccans | 58.3 /100 | #166 | Average 8.9% |