Immigrants from Barbados vs Immigrants from Russia Unemployment Among Women with Children Ages 6 to 17 years
COMPARE
Immigrants from Barbados
Immigrants from Russia
Unemployment Among Women with Children Ages 6 to 17 years
Unemployment Among Women with Children Ages 6 to 17 years Comparison
Immigrants from Barbados
Immigrants from Russia
8.5%
UNEMPLOYMENT AMONG WOMEN WITH CHILDREN AGES 6 TO 17 YEARS
98.8/ 100
METRIC RATING
94th/ 347
METRIC RANK
8.6%
UNEMPLOYMENT AMONG WOMEN WITH CHILDREN AGES 6 TO 17 YEARS
96.7/ 100
METRIC RATING
114th/ 347
METRIC RANK
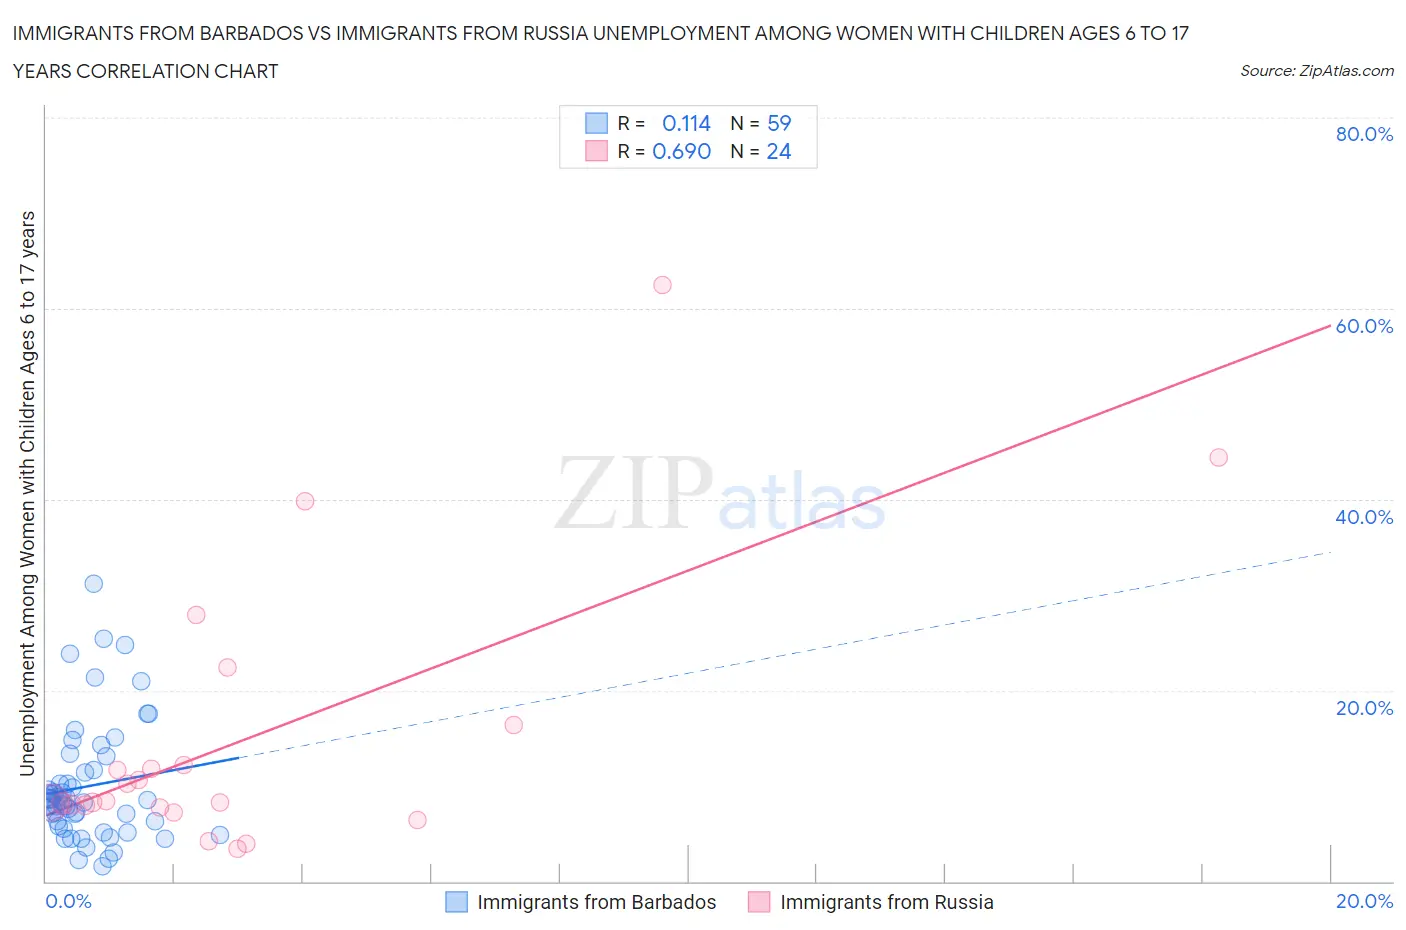
Immigrants from Barbados vs Immigrants from Russia Unemployment Among Women with Children Ages 6 to 17 years Correlation Chart
The statistical analysis conducted on geographies consisting of 98,607,035 people shows a poor positive correlation between the proportion of Immigrants from Barbados and unemployment rate among women with children between the ages 6 and 17 in the United States with a correlation coefficient (R) of 0.114 and weighted average of 8.5%. Similarly, the statistical analysis conducted on geographies consisting of 252,369,687 people shows a significant positive correlation between the proportion of Immigrants from Russia and unemployment rate among women with children between the ages 6 and 17 in the United States with a correlation coefficient (R) of 0.690 and weighted average of 8.6%, a difference of 1.1%.
Unemployment Among Women with Children Ages 6 to 17 years Correlation Summary
| Measurement | Immigrants from Barbados | Immigrants from Russia |
| Minimum | 1.6% | 3.4% |
| Maximum | 31.1% | 62.5% |
| Range | 29.5% | 59.1% |
| Mean | 9.9% | 15.0% |
| Median | 8.5% | 8.4% |
| Interquartile 25% (IQ1) | 5.7% | 7.8% |
| Interquartile 75% (IQ3) | 11.7% | 14.3% |
| Interquartile Range (IQR) | 6.0% | 6.5% |
| Standard Deviation (Sample) | 6.2% | 14.6% |
| Standard Deviation (Population) | 6.2% | 14.3% |
Demographics Similar to Immigrants from Barbados and Immigrants from Russia by Unemployment Among Women with Children Ages 6 to 17 years
In terms of unemployment among women with children ages 6 to 17 years, the demographic groups most similar to Immigrants from Barbados are Sri Lankan (8.5%, a difference of 0.060%), German Russian (8.5%, a difference of 0.12%), Bolivian (8.5%, a difference of 0.21%), Malaysian (8.6%, a difference of 0.25%), and Immigrants from Lithuania (8.6%, a difference of 0.33%). Similarly, the demographic groups most similar to Immigrants from Russia are Eastern European (8.6%, a difference of 0.010%), Romanian (8.6%, a difference of 0.16%), Immigrants from Ukraine (8.6%, a difference of 0.28%), Latvian (8.6%, a difference of 0.29%), and Immigrants from Romania (8.6%, a difference of 0.30%).
| Demographics | Rating | Rank | Unemployment Among Women with Children Ages 6 to 17 years |
| Immigrants | Barbados | 98.8 /100 | #94 | Exceptional 8.5% |
| Sri Lankans | 98.7 /100 | #95 | Exceptional 8.5% |
| German Russians | 98.6 /100 | #96 | Exceptional 8.5% |
| Bolivians | 98.5 /100 | #97 | Exceptional 8.5% |
| Malaysians | 98.5 /100 | #98 | Exceptional 8.6% |
| Immigrants | Lithuania | 98.4 /100 | #99 | Exceptional 8.6% |
| New Zealanders | 98.4 /100 | #100 | Exceptional 8.6% |
| Immigrants | Pakistan | 98.4 /100 | #101 | Exceptional 8.6% |
| Immigrants | South Africa | 98.3 /100 | #102 | Exceptional 8.6% |
| Scandinavians | 98.3 /100 | #103 | Exceptional 8.6% |
| Immigrants | France | 98.0 /100 | #104 | Exceptional 8.6% |
| Immigrants | Norway | 97.8 /100 | #105 | Exceptional 8.6% |
| Immigrants | Serbia | 97.7 /100 | #106 | Exceptional 8.6% |
| Chickasaw | 97.6 /100 | #107 | Exceptional 8.6% |
| Swedes | 97.6 /100 | #108 | Exceptional 8.6% |
| Immigrants | Romania | 97.5 /100 | #109 | Exceptional 8.6% |
| Latvians | 97.4 /100 | #110 | Exceptional 8.6% |
| Immigrants | Ukraine | 97.4 /100 | #111 | Exceptional 8.6% |
| Romanians | 97.1 /100 | #112 | Exceptional 8.6% |
| Eastern Europeans | 96.8 /100 | #113 | Exceptional 8.6% |
| Immigrants | Russia | 96.7 /100 | #114 | Exceptional 8.6% |