American vs Spanish Unemployment Among Women with Children Ages 6 to 17 years
COMPARE
American
Spanish
Unemployment Among Women with Children Ages 6 to 17 years
Unemployment Among Women with Children Ages 6 to 17 years Comparison
Americans
Spanish
10.4%
UNEMPLOYMENT AMONG WOMEN WITH CHILDREN AGES 6 TO 17 YEARS
0.0/ 100
METRIC RATING
313th/ 347
METRIC RANK
8.9%
UNEMPLOYMENT AMONG WOMEN WITH CHILDREN AGES 6 TO 17 YEARS
63.8/ 100
METRIC RATING
159th/ 347
METRIC RANK
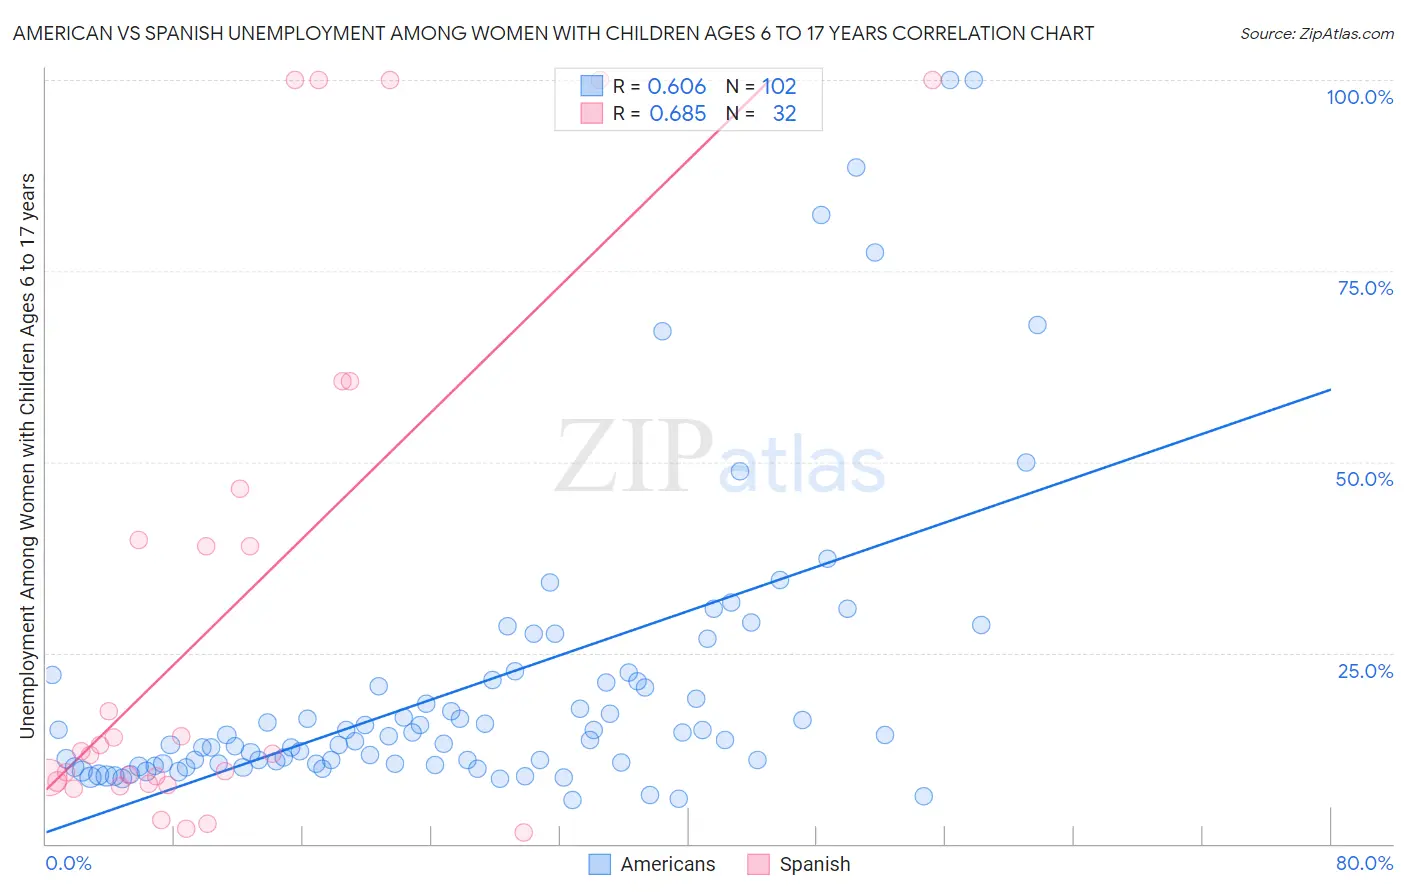
American vs Spanish Unemployment Among Women with Children Ages 6 to 17 years Correlation Chart
The statistical analysis conducted on geographies consisting of 361,036,029 people shows a significant positive correlation between the proportion of Americans and unemployment rate among women with children between the ages 6 and 17 in the United States with a correlation coefficient (R) of 0.606 and weighted average of 10.4%. Similarly, the statistical analysis conducted on geographies consisting of 298,620,036 people shows a significant positive correlation between the proportion of Spanish and unemployment rate among women with children between the ages 6 and 17 in the United States with a correlation coefficient (R) of 0.685 and weighted average of 8.9%, a difference of 16.9%.
Unemployment Among Women with Children Ages 6 to 17 years Correlation Summary
| Measurement | American | Spanish |
| Minimum | 5.8% | 1.4% |
| Maximum | 100.0% | 100.0% |
| Range | 94.2% | 98.6% |
| Mean | 20.6% | 30.4% |
| Median | 13.9% | 11.9% |
| Interquartile 25% (IQ1) | 10.4% | 8.0% |
| Interquartile 75% (IQ3) | 21.3% | 43.2% |
| Interquartile Range (IQR) | 10.8% | 35.2% |
| Standard Deviation (Sample) | 19.3% | 34.4% |
| Standard Deviation (Population) | 19.2% | 33.8% |
Similar Demographics by Unemployment Among Women with Children Ages 6 to 17 years
Demographics Similar to Americans by Unemployment Among Women with Children Ages 6 to 17 years
In terms of unemployment among women with children ages 6 to 17 years, the demographic groups most similar to Americans are Immigrants from Cabo Verde (10.4%, a difference of 0.050%), Bahamian (10.4%, a difference of 0.080%), African (10.4%, a difference of 0.18%), Immigrants from Dominica (10.5%, a difference of 0.83%), and Bermudan (10.5%, a difference of 0.94%).
| Demographics | Rating | Rank | Unemployment Among Women with Children Ages 6 to 17 years |
| Paraguayans | 0.0 /100 | #306 | Tragic 10.2% |
| Immigrants | Senegal | 0.0 /100 | #307 | Tragic 10.2% |
| Dutch West Indians | 0.0 /100 | #308 | Tragic 10.2% |
| French Canadians | 0.0 /100 | #309 | Tragic 10.3% |
| Alaska Natives | 0.0 /100 | #310 | Tragic 10.3% |
| Immigrants | Liberia | 0.0 /100 | #311 | Tragic 10.3% |
| Africans | 0.0 /100 | #312 | Tragic 10.4% |
| Americans | 0.0 /100 | #313 | Tragic 10.4% |
| Immigrants | Cabo Verde | 0.0 /100 | #314 | Tragic 10.4% |
| Bahamians | 0.0 /100 | #315 | Tragic 10.4% |
| Immigrants | Dominica | 0.0 /100 | #316 | Tragic 10.5% |
| Bermudans | 0.0 /100 | #317 | Tragic 10.5% |
| Delaware | 0.0 /100 | #318 | Tragic 10.5% |
| Immigrants | Uganda | 0.0 /100 | #319 | Tragic 10.7% |
| Apache | 0.0 /100 | #320 | Tragic 10.7% |
Demographics Similar to Spanish by Unemployment Among Women with Children Ages 6 to 17 years
In terms of unemployment among women with children ages 6 to 17 years, the demographic groups most similar to Spanish are Immigrants from Hungary (8.9%, a difference of 0.020%), Immigrants from Guyana (8.9%, a difference of 0.040%), Immigrants from Chile (8.9%, a difference of 0.070%), Immigrants from Belgium (8.9%, a difference of 0.090%), and Osage (8.9%, a difference of 0.10%).
| Demographics | Rating | Rank | Unemployment Among Women with Children Ages 6 to 17 years |
| Immigrants | Northern Europe | 74.6 /100 | #152 | Good 8.9% |
| Immigrants | Europe | 73.4 /100 | #153 | Good 8.9% |
| Vietnamese | 72.1 /100 | #154 | Good 8.9% |
| Immigrants | Greece | 71.8 /100 | #155 | Good 8.9% |
| Osage | 65.9 /100 | #156 | Good 8.9% |
| Immigrants | Belgium | 65.6 /100 | #157 | Good 8.9% |
| Immigrants | Chile | 65.3 /100 | #158 | Good 8.9% |
| Spanish | 63.8 /100 | #159 | Good 8.9% |
| Immigrants | Hungary | 63.4 /100 | #160 | Good 8.9% |
| Immigrants | Guyana | 63.0 /100 | #161 | Good 8.9% |
| Immigrants | Netherlands | 60.8 /100 | #162 | Good 8.9% |
| Mexican American Indians | 60.6 /100 | #163 | Good 8.9% |
| Ukrainians | 59.7 /100 | #164 | Average 8.9% |
| Immigrants | Micronesia | 59.2 /100 | #165 | Average 8.9% |
| Moroccans | 58.3 /100 | #166 | Average 8.9% |