Colville vs Spanish Unemployment Among Women with Children Ages 6 to 17 years
COMPARE
Colville
Spanish
Unemployment Among Women with Children Ages 6 to 17 years
Unemployment Among Women with Children Ages 6 to 17 years Comparison
Colville
Spanish
12.3%
UNEMPLOYMENT AMONG WOMEN WITH CHILDREN AGES 6 TO 17 YEARS
0.0/ 100
METRIC RATING
335th/ 347
METRIC RANK
8.9%
UNEMPLOYMENT AMONG WOMEN WITH CHILDREN AGES 6 TO 17 YEARS
63.8/ 100
METRIC RATING
159th/ 347
METRIC RANK
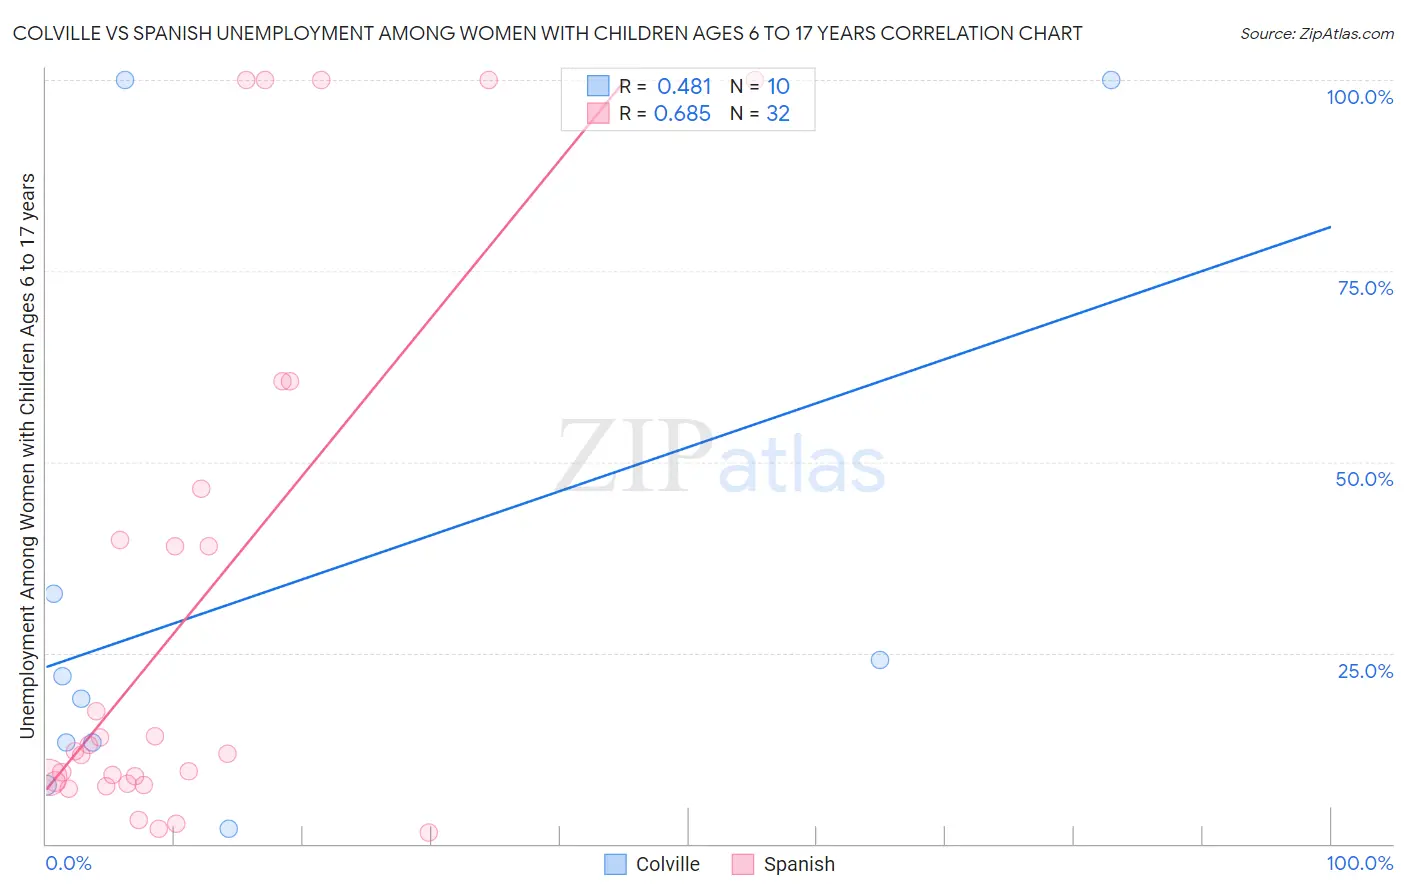
Colville vs Spanish Unemployment Among Women with Children Ages 6 to 17 years Correlation Chart
The statistical analysis conducted on geographies consisting of 31,705,481 people shows a moderate positive correlation between the proportion of Colville and unemployment rate among women with children between the ages 6 and 17 in the United States with a correlation coefficient (R) of 0.481 and weighted average of 12.3%. Similarly, the statistical analysis conducted on geographies consisting of 298,620,036 people shows a significant positive correlation between the proportion of Spanish and unemployment rate among women with children between the ages 6 and 17 in the United States with a correlation coefficient (R) of 0.685 and weighted average of 8.9%, a difference of 38.6%.
Unemployment Among Women with Children Ages 6 to 17 years Correlation Summary
| Measurement | Colville | Spanish |
| Minimum | 2.0% | 1.4% |
| Maximum | 100.0% | 100.0% |
| Range | 98.0% | 98.6% |
| Mean | 33.4% | 30.4% |
| Median | 20.5% | 11.9% |
| Interquartile 25% (IQ1) | 13.3% | 8.0% |
| Interquartile 75% (IQ3) | 32.7% | 43.2% |
| Interquartile Range (IQR) | 19.4% | 35.2% |
| Standard Deviation (Sample) | 36.1% | 34.4% |
| Standard Deviation (Population) | 34.3% | 33.8% |
Similar Demographics by Unemployment Among Women with Children Ages 6 to 17 years
Demographics Similar to Colville by Unemployment Among Women with Children Ages 6 to 17 years
In terms of unemployment among women with children ages 6 to 17 years, the demographic groups most similar to Colville are Houma (12.5%, a difference of 0.97%), Ugandan (12.0%, a difference of 2.7%), Immigrants from Yemen (12.7%, a difference of 2.9%), Hopi (12.9%, a difference of 4.4%), and Sioux (13.2%, a difference of 7.2%).
| Demographics | Rating | Rank | Unemployment Among Women with Children Ages 6 to 17 years |
| Ottawa | 0.0 /100 | #328 | Tragic 10.9% |
| Pennsylvania Germans | 0.0 /100 | #329 | Tragic 11.0% |
| Chippewa | 0.0 /100 | #330 | Tragic 11.1% |
| Blacks/African Americans | 0.0 /100 | #331 | Tragic 11.4% |
| Tsimshian | 0.0 /100 | #332 | Tragic 11.4% |
| Natives/Alaskans | 0.0 /100 | #333 | Tragic 11.5% |
| Ugandans | 0.0 /100 | #334 | Tragic 12.0% |
| Colville | 0.0 /100 | #335 | Tragic 12.3% |
| Houma | 0.0 /100 | #336 | Tragic 12.5% |
| Immigrants | Yemen | 0.0 /100 | #337 | Tragic 12.7% |
| Hopi | 0.0 /100 | #338 | Tragic 12.9% |
| Sioux | 0.0 /100 | #339 | Tragic 13.2% |
| Puerto Ricans | 0.0 /100 | #340 | Tragic 13.9% |
| Navajo | 0.0 /100 | #341 | Tragic 14.2% |
| Yuman | 0.0 /100 | #342 | Tragic 14.8% |
Demographics Similar to Spanish by Unemployment Among Women with Children Ages 6 to 17 years
In terms of unemployment among women with children ages 6 to 17 years, the demographic groups most similar to Spanish are Immigrants from Hungary (8.9%, a difference of 0.020%), Immigrants from Guyana (8.9%, a difference of 0.040%), Immigrants from Chile (8.9%, a difference of 0.070%), Immigrants from Belgium (8.9%, a difference of 0.090%), and Osage (8.9%, a difference of 0.10%).
| Demographics | Rating | Rank | Unemployment Among Women with Children Ages 6 to 17 years |
| Immigrants | Northern Europe | 74.6 /100 | #152 | Good 8.9% |
| Immigrants | Europe | 73.4 /100 | #153 | Good 8.9% |
| Vietnamese | 72.1 /100 | #154 | Good 8.9% |
| Immigrants | Greece | 71.8 /100 | #155 | Good 8.9% |
| Osage | 65.9 /100 | #156 | Good 8.9% |
| Immigrants | Belgium | 65.6 /100 | #157 | Good 8.9% |
| Immigrants | Chile | 65.3 /100 | #158 | Good 8.9% |
| Spanish | 63.8 /100 | #159 | Good 8.9% |
| Immigrants | Hungary | 63.4 /100 | #160 | Good 8.9% |
| Immigrants | Guyana | 63.0 /100 | #161 | Good 8.9% |
| Immigrants | Netherlands | 60.8 /100 | #162 | Good 8.9% |
| Mexican American Indians | 60.6 /100 | #163 | Good 8.9% |
| Ukrainians | 59.7 /100 | #164 | Average 8.9% |
| Immigrants | Micronesia | 59.2 /100 | #165 | Average 8.9% |
| Moroccans | 58.3 /100 | #166 | Average 8.9% |