Immigrants from Barbados vs Immigrants from Cabo Verde Unemployment Among Women with Children Ages 6 to 17 years
COMPARE
Immigrants from Barbados
Immigrants from Cabo Verde
Unemployment Among Women with Children Ages 6 to 17 years
Unemployment Among Women with Children Ages 6 to 17 years Comparison
Immigrants from Barbados
Immigrants from Cabo Verde
8.5%
UNEMPLOYMENT AMONG WOMEN WITH CHILDREN AGES 6 TO 17 YEARS
98.8/ 100
METRIC RATING
94th/ 347
METRIC RANK
10.4%
UNEMPLOYMENT AMONG WOMEN WITH CHILDREN AGES 6 TO 17 YEARS
0.0/ 100
METRIC RATING
314th/ 347
METRIC RANK
Immigrants from Barbados vs Immigrants from Cabo Verde Unemployment Among Women with Children Ages 6 to 17 years Correlation Chart
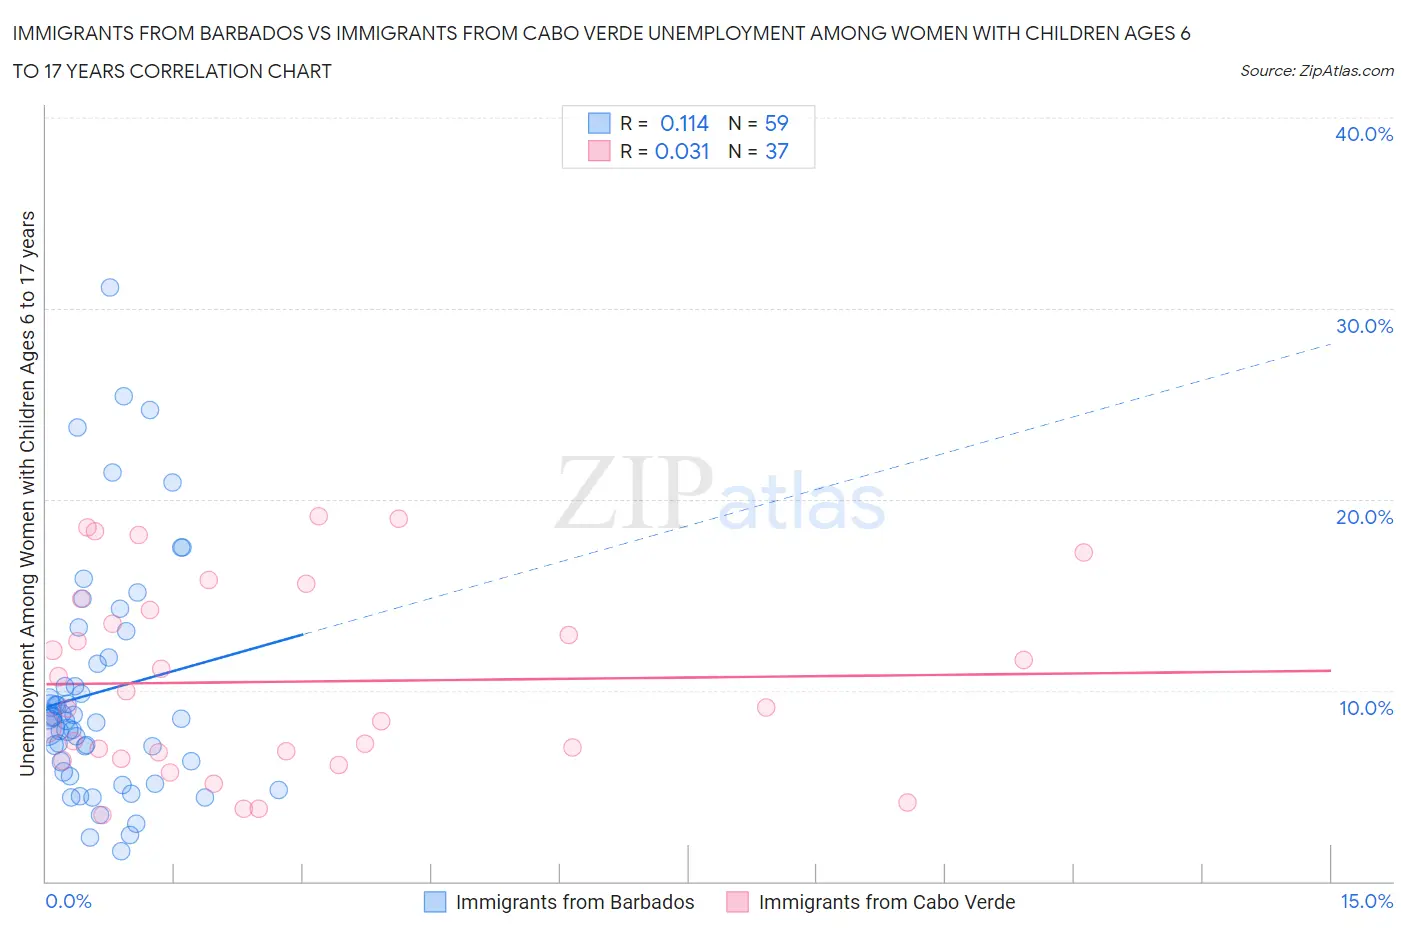
The statistical analysis conducted on geographies consisting of 98,607,035 people shows a poor positive correlation between the proportion of Immigrants from Barbados and unemployment rate among women with children between the ages 6 and 17 in the United States with a correlation coefficient (R) of 0.114 and weighted average of 8.5%. Similarly, the statistical analysis conducted on geographies consisting of 33,958,446 people shows no correlation between the proportion of Immigrants from Cabo Verde and unemployment rate among women with children between the ages 6 and 17 in the United States with a correlation coefficient (R) of 0.031 and weighted average of 10.4%, a difference of 22.2%.
Unemployment Among Women with Children Ages 6 to 17 years Correlation Summary
| Measurement | Immigrants from Barbados | Immigrants from Cabo Verde |
| Minimum | 1.6% | 3.5% |
| Maximum | 31.1% | 19.1% |
| Range | 29.5% | 15.6% |
| Mean | 9.9% | 10.4% |
| Median | 8.5% | 9.1% |
| Interquartile 25% (IQ1) | 5.7% | 6.6% |
| Interquartile 75% (IQ3) | 11.7% | 14.5% |
| Interquartile Range (IQR) | 6.0% | 7.9% |
| Standard Deviation (Sample) | 6.2% | 4.9% |
| Standard Deviation (Population) | 6.2% | 4.8% |
Similar Demographics by Unemployment Among Women with Children Ages 6 to 17 years
Demographics Similar to Immigrants from Barbados by Unemployment Among Women with Children Ages 6 to 17 years
In terms of unemployment among women with children ages 6 to 17 years, the demographic groups most similar to Immigrants from Barbados are Sri Lankan (8.5%, a difference of 0.060%), Australian (8.5%, a difference of 0.11%), German Russian (8.5%, a difference of 0.12%), Bolivian (8.5%, a difference of 0.21%), and Potawatomi (8.5%, a difference of 0.23%).
| Demographics | Rating | Rank | Unemployment Among Women with Children Ages 6 to 17 years |
| Immigrants | Israel | 99.1 /100 | #87 | Exceptional 8.5% |
| Immigrants | Vietnam | 99.1 /100 | #88 | Exceptional 8.5% |
| Paiute | 99.1 /100 | #89 | Exceptional 8.5% |
| Yugoslavians | 99.0 /100 | #90 | Exceptional 8.5% |
| Immigrants | Eastern Europe | 99.0 /100 | #91 | Exceptional 8.5% |
| Potawatomi | 99.0 /100 | #92 | Exceptional 8.5% |
| Australians | 98.9 /100 | #93 | Exceptional 8.5% |
| Immigrants | Barbados | 98.8 /100 | #94 | Exceptional 8.5% |
| Sri Lankans | 98.7 /100 | #95 | Exceptional 8.5% |
| German Russians | 98.6 /100 | #96 | Exceptional 8.5% |
| Bolivians | 98.5 /100 | #97 | Exceptional 8.5% |
| Malaysians | 98.5 /100 | #98 | Exceptional 8.6% |
| Immigrants | Lithuania | 98.4 /100 | #99 | Exceptional 8.6% |
| New Zealanders | 98.4 /100 | #100 | Exceptional 8.6% |
| Immigrants | Pakistan | 98.4 /100 | #101 | Exceptional 8.6% |
Demographics Similar to Immigrants from Cabo Verde by Unemployment Among Women with Children Ages 6 to 17 years
In terms of unemployment among women with children ages 6 to 17 years, the demographic groups most similar to Immigrants from Cabo Verde are Bahamian (10.4%, a difference of 0.030%), American (10.4%, a difference of 0.050%), African (10.4%, a difference of 0.23%), Immigrants from Dominica (10.5%, a difference of 0.78%), and Bermudan (10.5%, a difference of 0.89%).
| Demographics | Rating | Rank | Unemployment Among Women with Children Ages 6 to 17 years |
| Immigrants | Senegal | 0.0 /100 | #307 | Tragic 10.2% |
| Dutch West Indians | 0.0 /100 | #308 | Tragic 10.2% |
| French Canadians | 0.0 /100 | #309 | Tragic 10.3% |
| Alaska Natives | 0.0 /100 | #310 | Tragic 10.3% |
| Immigrants | Liberia | 0.0 /100 | #311 | Tragic 10.3% |
| Africans | 0.0 /100 | #312 | Tragic 10.4% |
| Americans | 0.0 /100 | #313 | Tragic 10.4% |
| Immigrants | Cabo Verde | 0.0 /100 | #314 | Tragic 10.4% |
| Bahamians | 0.0 /100 | #315 | Tragic 10.4% |
| Immigrants | Dominica | 0.0 /100 | #316 | Tragic 10.5% |
| Bermudans | 0.0 /100 | #317 | Tragic 10.5% |
| Delaware | 0.0 /100 | #318 | Tragic 10.5% |
| Immigrants | Uganda | 0.0 /100 | #319 | Tragic 10.7% |
| Apache | 0.0 /100 | #320 | Tragic 10.7% |
| Tohono O'odham | 0.0 /100 | #321 | Tragic 10.7% |