German vs Spanish Unemployment Among Women with Children Ages 6 to 17 years
COMPARE
German
Spanish
Unemployment Among Women with Children Ages 6 to 17 years
Unemployment Among Women with Children Ages 6 to 17 years Comparison
Germans
Spanish
9.2%
UNEMPLOYMENT AMONG WOMEN WITH CHILDREN AGES 6 TO 17 YEARS
7.2/ 100
METRIC RATING
217th/ 347
METRIC RANK
8.9%
UNEMPLOYMENT AMONG WOMEN WITH CHILDREN AGES 6 TO 17 YEARS
63.8/ 100
METRIC RATING
159th/ 347
METRIC RANK
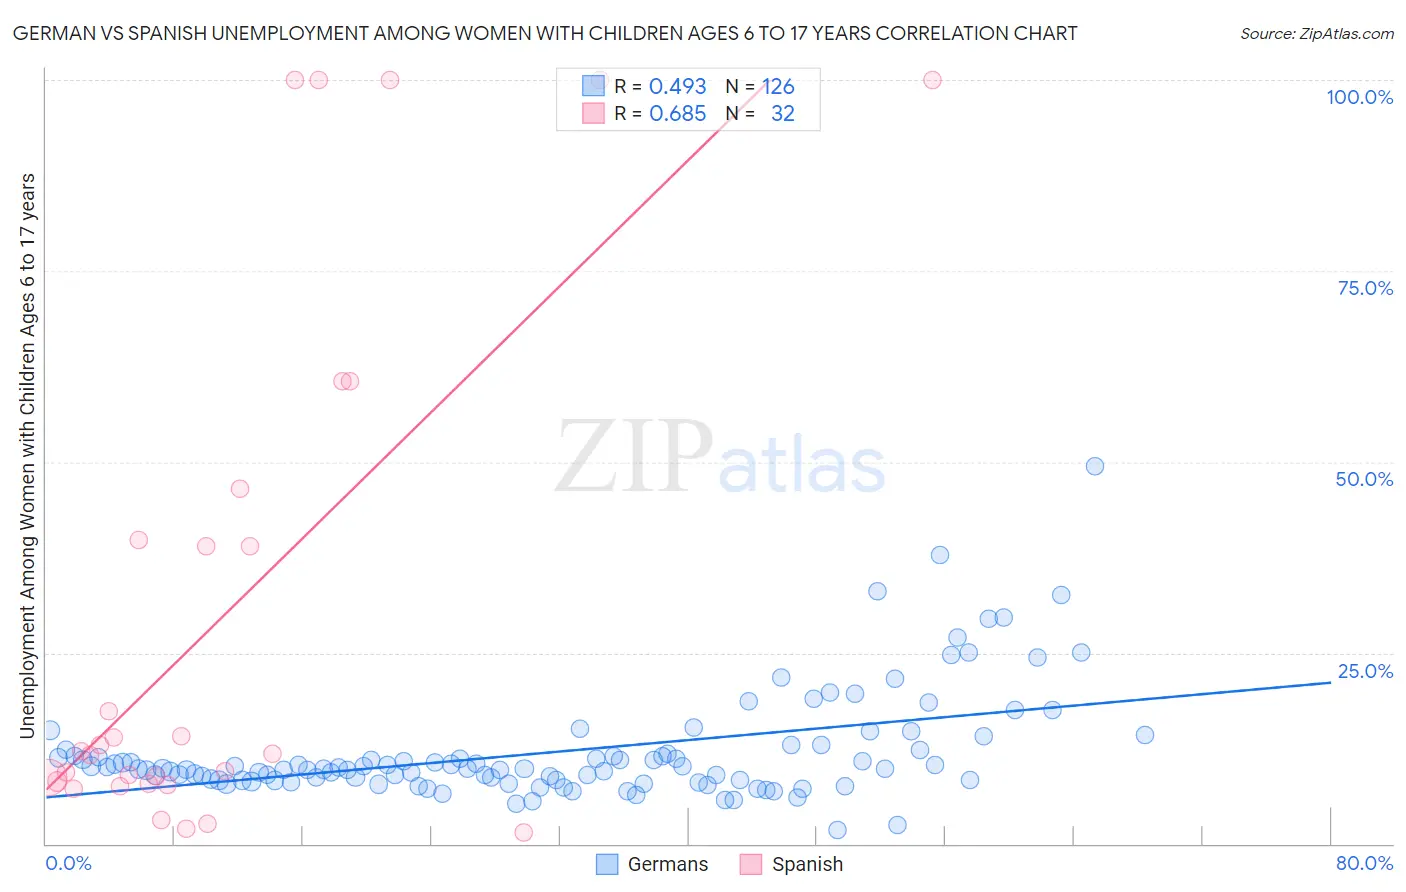
German vs Spanish Unemployment Among Women with Children Ages 6 to 17 years Correlation Chart
The statistical analysis conducted on geographies consisting of 359,814,108 people shows a moderate positive correlation between the proportion of Germans and unemployment rate among women with children between the ages 6 and 17 in the United States with a correlation coefficient (R) of 0.493 and weighted average of 9.2%. Similarly, the statistical analysis conducted on geographies consisting of 298,620,036 people shows a significant positive correlation between the proportion of Spanish and unemployment rate among women with children between the ages 6 and 17 in the United States with a correlation coefficient (R) of 0.685 and weighted average of 8.9%, a difference of 3.5%.
Unemployment Among Women with Children Ages 6 to 17 years Correlation Summary
| Measurement | German | Spanish |
| Minimum | 1.8% | 1.4% |
| Maximum | 49.5% | 100.0% |
| Range | 47.7% | 98.6% |
| Mean | 12.0% | 30.4% |
| Median | 9.8% | 11.9% |
| Interquartile 25% (IQ1) | 8.3% | 8.0% |
| Interquartile 75% (IQ3) | 11.8% | 43.2% |
| Interquartile Range (IQR) | 3.5% | 35.2% |
| Standard Deviation (Sample) | 7.0% | 34.4% |
| Standard Deviation (Population) | 7.0% | 33.8% |
Similar Demographics by Unemployment Among Women with Children Ages 6 to 17 years
Demographics Similar to Germans by Unemployment Among Women with Children Ages 6 to 17 years
In terms of unemployment among women with children ages 6 to 17 years, the demographic groups most similar to Germans are Immigrants from Germany (9.2%, a difference of 0.010%), Immigrants from Uruguay (9.2%, a difference of 0.010%), Iroquois (9.2%, a difference of 0.050%), Syrian (9.2%, a difference of 0.050%), and Immigrants from Scotland (9.2%, a difference of 0.10%).
| Demographics | Rating | Rank | Unemployment Among Women with Children Ages 6 to 17 years |
| Finns | 10.0 /100 | #210 | Tragic 9.2% |
| Immigrants | Cuba | 9.6 /100 | #211 | Tragic 9.2% |
| Peruvians | 9.0 /100 | #212 | Tragic 9.2% |
| Spaniards | 8.2 /100 | #213 | Tragic 9.2% |
| Iroquois | 7.5 /100 | #214 | Tragic 9.2% |
| Immigrants | Germany | 7.2 /100 | #215 | Tragic 9.2% |
| Immigrants | Uruguay | 7.2 /100 | #216 | Tragic 9.2% |
| Germans | 7.2 /100 | #217 | Tragic 9.2% |
| Syrians | 6.9 /100 | #218 | Tragic 9.2% |
| Immigrants | Scotland | 6.6 /100 | #219 | Tragic 9.2% |
| Belgians | 6.4 /100 | #220 | Tragic 9.2% |
| Crow | 5.8 /100 | #221 | Tragic 9.2% |
| Immigrants | Southern Europe | 5.8 /100 | #222 | Tragic 9.2% |
| Immigrants | Eritrea | 5.8 /100 | #223 | Tragic 9.2% |
| Immigrants | El Salvador | 5.3 /100 | #224 | Tragic 9.3% |
Demographics Similar to Spanish by Unemployment Among Women with Children Ages 6 to 17 years
In terms of unemployment among women with children ages 6 to 17 years, the demographic groups most similar to Spanish are Immigrants from Hungary (8.9%, a difference of 0.020%), Immigrants from Guyana (8.9%, a difference of 0.040%), Immigrants from Chile (8.9%, a difference of 0.070%), Immigrants from Belgium (8.9%, a difference of 0.090%), and Osage (8.9%, a difference of 0.10%).
| Demographics | Rating | Rank | Unemployment Among Women with Children Ages 6 to 17 years |
| Immigrants | Northern Europe | 74.6 /100 | #152 | Good 8.9% |
| Immigrants | Europe | 73.4 /100 | #153 | Good 8.9% |
| Vietnamese | 72.1 /100 | #154 | Good 8.9% |
| Immigrants | Greece | 71.8 /100 | #155 | Good 8.9% |
| Osage | 65.9 /100 | #156 | Good 8.9% |
| Immigrants | Belgium | 65.6 /100 | #157 | Good 8.9% |
| Immigrants | Chile | 65.3 /100 | #158 | Good 8.9% |
| Spanish | 63.8 /100 | #159 | Good 8.9% |
| Immigrants | Hungary | 63.4 /100 | #160 | Good 8.9% |
| Immigrants | Guyana | 63.0 /100 | #161 | Good 8.9% |
| Immigrants | Netherlands | 60.8 /100 | #162 | Good 8.9% |
| Mexican American Indians | 60.6 /100 | #163 | Good 8.9% |
| Ukrainians | 59.7 /100 | #164 | Average 8.9% |
| Immigrants | Micronesia | 59.2 /100 | #165 | Average 8.9% |
| Moroccans | 58.3 /100 | #166 | Average 8.9% |