Bermudan vs Immigrants from Cabo Verde Unemployment Among Women with Children Ages 6 to 17 years
COMPARE
Bermudan
Immigrants from Cabo Verde
Unemployment Among Women with Children Ages 6 to 17 years
Unemployment Among Women with Children Ages 6 to 17 years Comparison
Bermudans
Immigrants from Cabo Verde
10.5%
UNEMPLOYMENT AMONG WOMEN WITH CHILDREN AGES 6 TO 17 YEARS
0.0/ 100
METRIC RATING
317th/ 347
METRIC RANK
10.4%
UNEMPLOYMENT AMONG WOMEN WITH CHILDREN AGES 6 TO 17 YEARS
0.0/ 100
METRIC RATING
314th/ 347
METRIC RANK
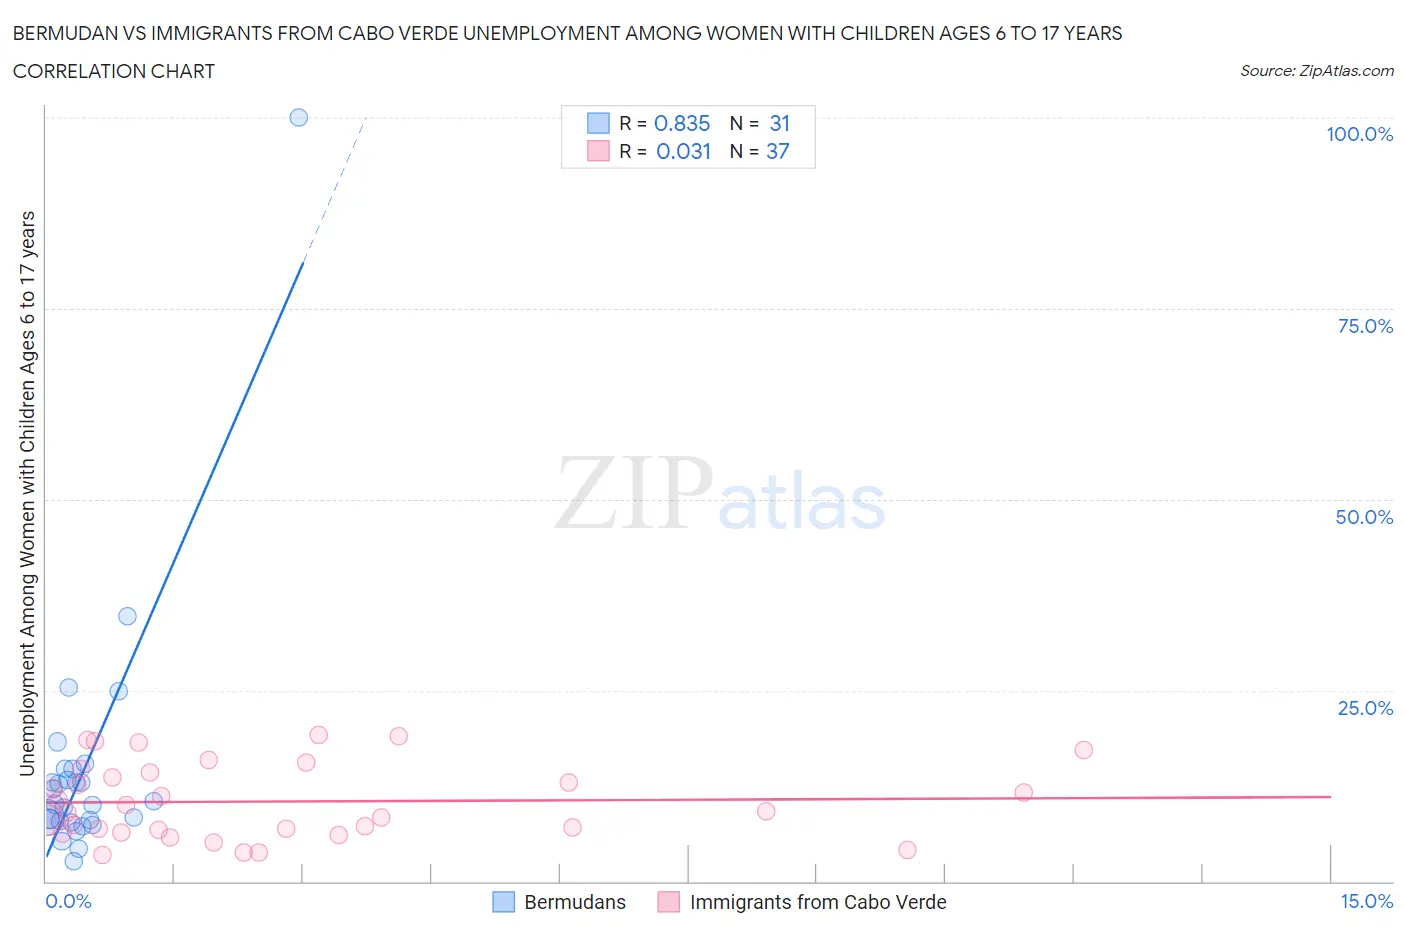
Bermudan vs Immigrants from Cabo Verde Unemployment Among Women with Children Ages 6 to 17 years Correlation Chart
The statistical analysis conducted on geographies consisting of 51,078,380 people shows a very strong positive correlation between the proportion of Bermudans and unemployment rate among women with children between the ages 6 and 17 in the United States with a correlation coefficient (R) of 0.835 and weighted average of 10.5%. Similarly, the statistical analysis conducted on geographies consisting of 33,958,446 people shows no correlation between the proportion of Immigrants from Cabo Verde and unemployment rate among women with children between the ages 6 and 17 in the United States with a correlation coefficient (R) of 0.031 and weighted average of 10.4%, a difference of 0.89%.
Unemployment Among Women with Children Ages 6 to 17 years Correlation Summary
| Measurement | Bermudan | Immigrants from Cabo Verde |
| Minimum | 2.7% | 3.5% |
| Maximum | 100.0% | 19.1% |
| Range | 97.3% | 15.6% |
| Mean | 14.7% | 10.4% |
| Median | 10.1% | 9.1% |
| Interquartile 25% (IQ1) | 7.9% | 6.6% |
| Interquartile 75% (IQ3) | 14.7% | 14.5% |
| Interquartile Range (IQR) | 6.9% | 7.9% |
| Standard Deviation (Sample) | 17.2% | 4.9% |
| Standard Deviation (Population) | 16.9% | 4.8% |
Demographics Similar to Bermudans and Immigrants from Cabo Verde by Unemployment Among Women with Children Ages 6 to 17 years
In terms of unemployment among women with children ages 6 to 17 years, the demographic groups most similar to Bermudans are Delaware (10.5%, a difference of 0.020%), Immigrants from Dominica (10.5%, a difference of 0.12%), Bahamian (10.4%, a difference of 0.87%), American (10.4%, a difference of 0.94%), and African (10.4%, a difference of 1.1%). Similarly, the demographic groups most similar to Immigrants from Cabo Verde are Bahamian (10.4%, a difference of 0.030%), American (10.4%, a difference of 0.050%), African (10.4%, a difference of 0.23%), Immigrants from Dominica (10.5%, a difference of 0.78%), and Delaware (10.5%, a difference of 0.91%).
| Demographics | Rating | Rank | Unemployment Among Women with Children Ages 6 to 17 years |
| Immigrants | Nigeria | 0.0 /100 | #305 | Tragic 10.2% |
| Paraguayans | 0.0 /100 | #306 | Tragic 10.2% |
| Immigrants | Senegal | 0.0 /100 | #307 | Tragic 10.2% |
| Dutch West Indians | 0.0 /100 | #308 | Tragic 10.2% |
| French Canadians | 0.0 /100 | #309 | Tragic 10.3% |
| Alaska Natives | 0.0 /100 | #310 | Tragic 10.3% |
| Immigrants | Liberia | 0.0 /100 | #311 | Tragic 10.3% |
| Africans | 0.0 /100 | #312 | Tragic 10.4% |
| Americans | 0.0 /100 | #313 | Tragic 10.4% |
| Immigrants | Cabo Verde | 0.0 /100 | #314 | Tragic 10.4% |
| Bahamians | 0.0 /100 | #315 | Tragic 10.4% |
| Immigrants | Dominica | 0.0 /100 | #316 | Tragic 10.5% |
| Bermudans | 0.0 /100 | #317 | Tragic 10.5% |
| Delaware | 0.0 /100 | #318 | Tragic 10.5% |
| Immigrants | Uganda | 0.0 /100 | #319 | Tragic 10.7% |
| Apache | 0.0 /100 | #320 | Tragic 10.7% |
| Tohono O'odham | 0.0 /100 | #321 | Tragic 10.7% |
| Cree | 0.0 /100 | #322 | Tragic 10.8% |
| Dominicans | 0.0 /100 | #323 | Tragic 10.8% |
| Immigrants | Dominican Republic | 0.0 /100 | #324 | Tragic 10.8% |
| Cajuns | 0.0 /100 | #325 | Tragic 10.8% |