Immigrants from Hong Kong vs Immigrants from Cabo Verde Unemployment Among Women with Children Ages 6 to 17 years
COMPARE
Immigrants from Hong Kong
Immigrants from Cabo Verde
Unemployment Among Women with Children Ages 6 to 17 years
Unemployment Among Women with Children Ages 6 to 17 years Comparison
Immigrants from Hong Kong
Immigrants from Cabo Verde
7.2%
UNEMPLOYMENT AMONG WOMEN WITH CHILDREN AGES 6 TO 17 YEARS
100.0/ 100
METRIC RATING
8th/ 347
METRIC RANK
10.4%
UNEMPLOYMENT AMONG WOMEN WITH CHILDREN AGES 6 TO 17 YEARS
0.0/ 100
METRIC RATING
314th/ 347
METRIC RANK
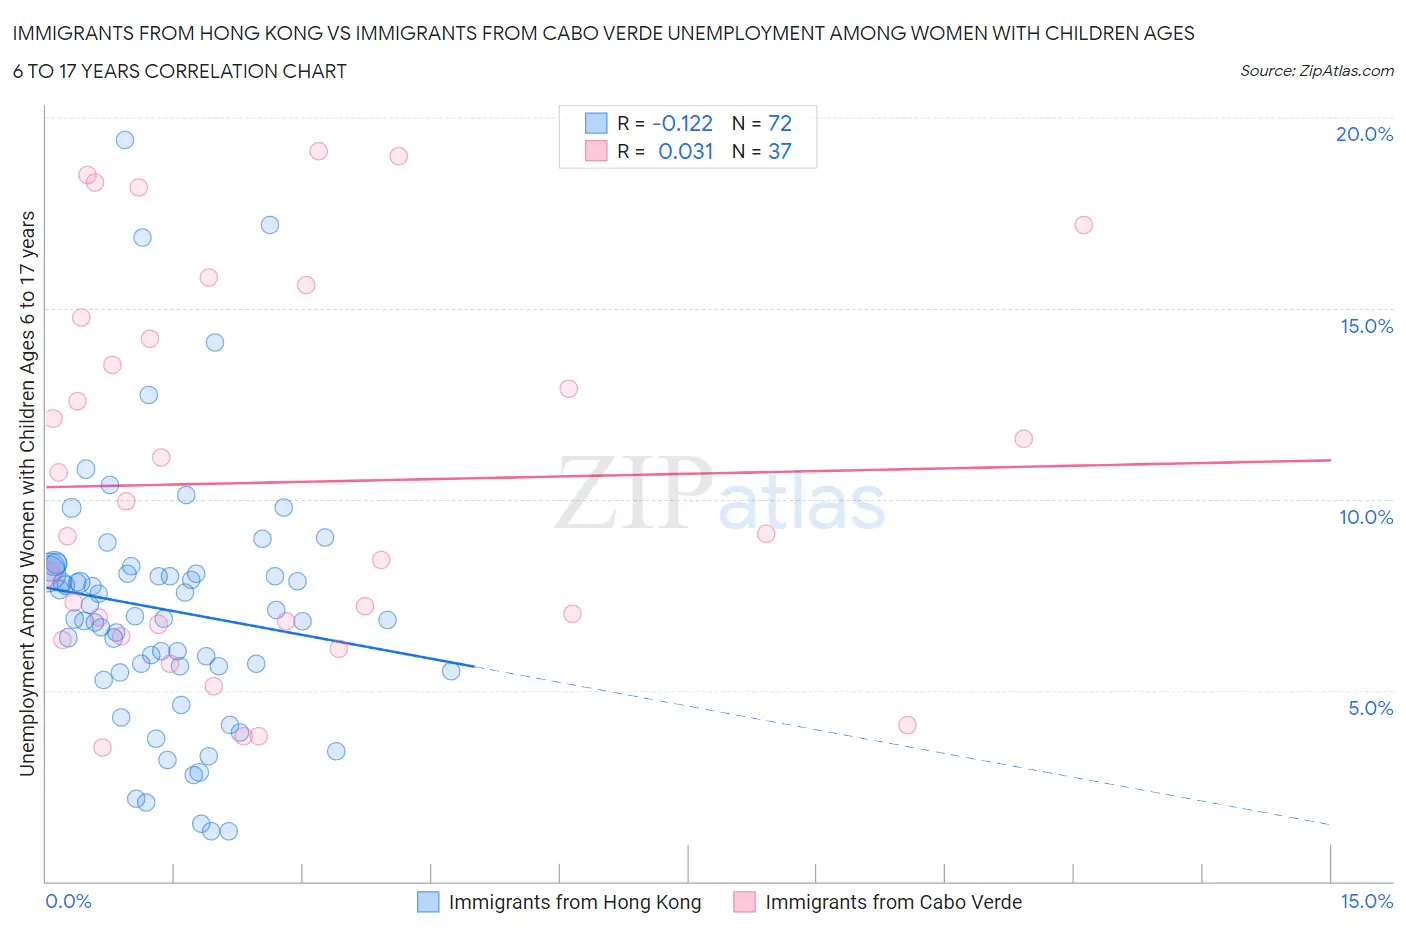
Immigrants from Hong Kong vs Immigrants from Cabo Verde Unemployment Among Women with Children Ages 6 to 17 years Correlation Chart
The statistical analysis conducted on geographies consisting of 197,270,459 people shows a poor negative correlation between the proportion of Immigrants from Hong Kong and unemployment rate among women with children between the ages 6 and 17 in the United States with a correlation coefficient (R) of -0.122 and weighted average of 7.2%. Similarly, the statistical analysis conducted on geographies consisting of 33,958,446 people shows no correlation between the proportion of Immigrants from Cabo Verde and unemployment rate among women with children between the ages 6 and 17 in the United States with a correlation coefficient (R) of 0.031 and weighted average of 10.4%, a difference of 45.0%.
Unemployment Among Women with Children Ages 6 to 17 years Correlation Summary
| Measurement | Immigrants from Hong Kong | Immigrants from Cabo Verde |
| Minimum | 1.3% | 3.5% |
| Maximum | 19.4% | 19.1% |
| Range | 18.1% | 15.6% |
| Mean | 7.1% | 10.4% |
| Median | 6.9% | 9.1% |
| Interquartile 25% (IQ1) | 5.6% | 6.6% |
| Interquartile 75% (IQ3) | 8.1% | 14.5% |
| Interquartile Range (IQR) | 2.5% | 7.9% |
| Standard Deviation (Sample) | 3.4% | 4.9% |
| Standard Deviation (Population) | 3.3% | 4.8% |
Similar Demographics by Unemployment Among Women with Children Ages 6 to 17 years
Demographics Similar to Immigrants from Hong Kong by Unemployment Among Women with Children Ages 6 to 17 years
In terms of unemployment among women with children ages 6 to 17 years, the demographic groups most similar to Immigrants from Hong Kong are Assyrian/Chaldean/Syriac (7.2%, a difference of 0.31%), Immigrants from Fiji (7.3%, a difference of 1.3%), Soviet Union (7.1%, a difference of 1.4%), Tlingit-Haida (7.1%, a difference of 1.5%), and Okinawan (7.0%, a difference of 2.0%).
| Demographics | Rating | Rank | Unemployment Among Women with Children Ages 6 to 17 years |
| Taiwanese | 100.0 /100 | #1 | Exceptional 6.5% |
| Fijians | 100.0 /100 | #2 | Exceptional 6.6% |
| Tongans | 100.0 /100 | #3 | Exceptional 6.7% |
| Ute | 100.0 /100 | #4 | Exceptional 7.0% |
| Okinawans | 100.0 /100 | #5 | Exceptional 7.0% |
| Tlingit-Haida | 100.0 /100 | #6 | Exceptional 7.1% |
| Soviet Union | 100.0 /100 | #7 | Exceptional 7.1% |
| Immigrants | Hong Kong | 100.0 /100 | #8 | Exceptional 7.2% |
| Assyrians/Chaldeans/Syriacs | 100.0 /100 | #9 | Exceptional 7.2% |
| Immigrants | Fiji | 100.0 /100 | #10 | Exceptional 7.3% |
| Immigrants | Taiwan | 100.0 /100 | #11 | Exceptional 7.3% |
| Bangladeshis | 100.0 /100 | #12 | Exceptional 7.4% |
| Indonesians | 100.0 /100 | #13 | Exceptional 7.4% |
| Sudanese | 100.0 /100 | #14 | Exceptional 7.4% |
| Puget Sound Salish | 100.0 /100 | #15 | Exceptional 7.5% |
Demographics Similar to Immigrants from Cabo Verde by Unemployment Among Women with Children Ages 6 to 17 years
In terms of unemployment among women with children ages 6 to 17 years, the demographic groups most similar to Immigrants from Cabo Verde are Bahamian (10.4%, a difference of 0.030%), American (10.4%, a difference of 0.050%), African (10.4%, a difference of 0.23%), Immigrants from Dominica (10.5%, a difference of 0.78%), and Bermudan (10.5%, a difference of 0.89%).
| Demographics | Rating | Rank | Unemployment Among Women with Children Ages 6 to 17 years |
| Immigrants | Senegal | 0.0 /100 | #307 | Tragic 10.2% |
| Dutch West Indians | 0.0 /100 | #308 | Tragic 10.2% |
| French Canadians | 0.0 /100 | #309 | Tragic 10.3% |
| Alaska Natives | 0.0 /100 | #310 | Tragic 10.3% |
| Immigrants | Liberia | 0.0 /100 | #311 | Tragic 10.3% |
| Africans | 0.0 /100 | #312 | Tragic 10.4% |
| Americans | 0.0 /100 | #313 | Tragic 10.4% |
| Immigrants | Cabo Verde | 0.0 /100 | #314 | Tragic 10.4% |
| Bahamians | 0.0 /100 | #315 | Tragic 10.4% |
| Immigrants | Dominica | 0.0 /100 | #316 | Tragic 10.5% |
| Bermudans | 0.0 /100 | #317 | Tragic 10.5% |
| Delaware | 0.0 /100 | #318 | Tragic 10.5% |
| Immigrants | Uganda | 0.0 /100 | #319 | Tragic 10.7% |
| Apache | 0.0 /100 | #320 | Tragic 10.7% |
| Tohono O'odham | 0.0 /100 | #321 | Tragic 10.7% |