Dutch West Indian vs Immigrants from Saudi Arabia Unemployment
COMPARE
Dutch West Indian
Immigrants from Saudi Arabia
Unemployment
Unemployment Comparison
Dutch West Indians
Immigrants from Saudi Arabia
5.6%
UNEMPLOYMENT
1.2/ 100
METRIC RATING
244th/ 347
METRIC RANK
5.1%
UNEMPLOYMENT
85.6/ 100
METRIC RATING
137th/ 347
METRIC RANK
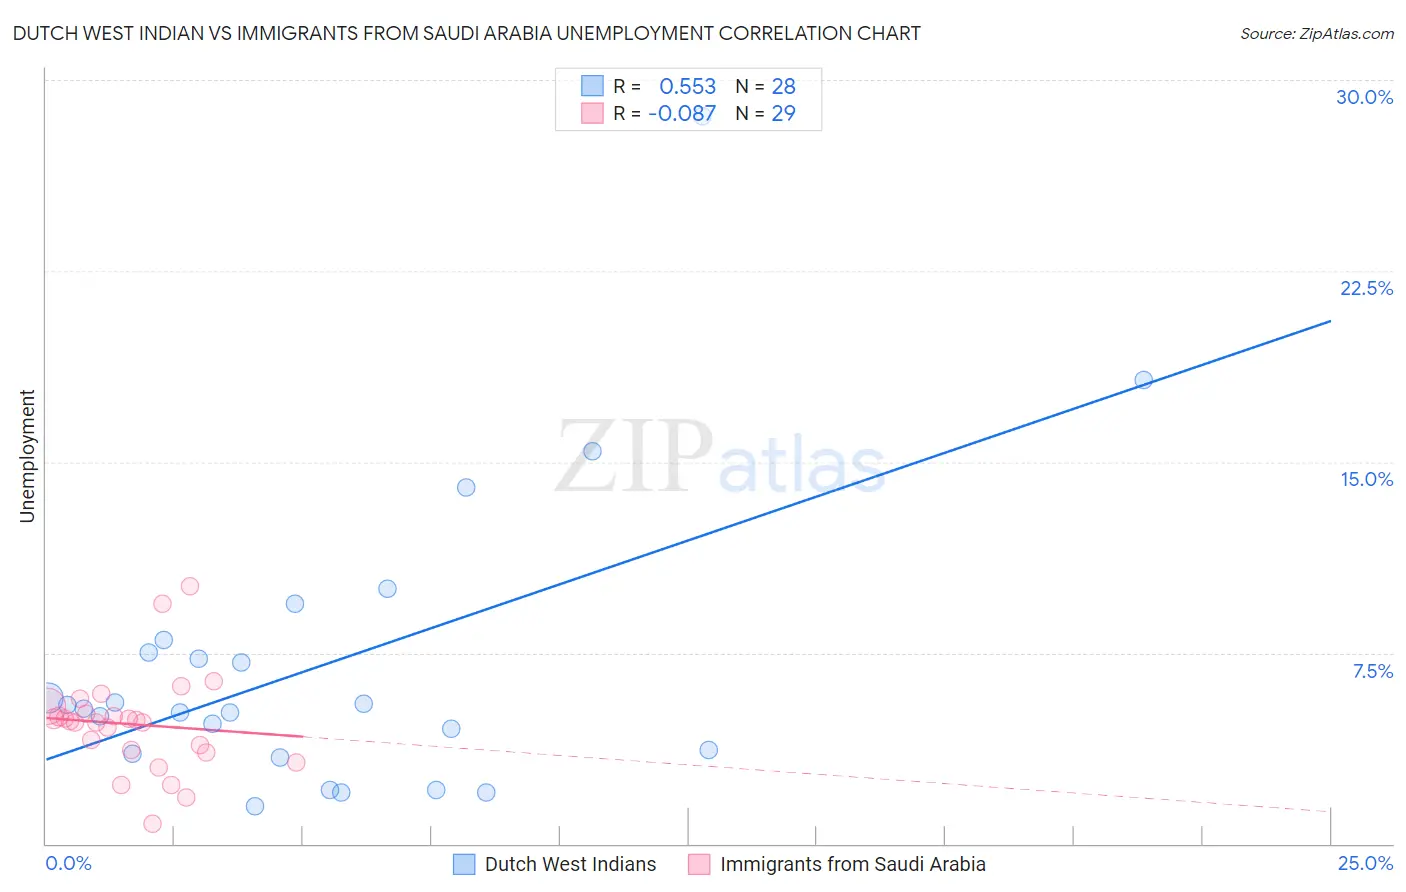
Dutch West Indian vs Immigrants from Saudi Arabia Unemployment Correlation Chart
The statistical analysis conducted on geographies consisting of 85,705,880 people shows a substantial positive correlation between the proportion of Dutch West Indians and unemployment in the United States with a correlation coefficient (R) of 0.553 and weighted average of 5.6%. Similarly, the statistical analysis conducted on geographies consisting of 164,272,517 people shows a slight negative correlation between the proportion of Immigrants from Saudi Arabia and unemployment in the United States with a correlation coefficient (R) of -0.087 and weighted average of 5.1%, a difference of 9.8%.
Unemployment Correlation Summary
| Measurement | Dutch West Indian | Immigrants from Saudi Arabia |
| Minimum | 1.5% | 0.80% |
| Maximum | 28.6% | 10.1% |
| Range | 27.1% | 9.3% |
| Mean | 7.1% | 4.7% |
| Median | 5.4% | 4.8% |
| Interquartile 25% (IQ1) | 3.6% | 3.6% |
| Interquartile 75% (IQ3) | 7.8% | 5.3% |
| Interquartile Range (IQR) | 4.1% | 1.6% |
| Standard Deviation (Sample) | 5.9% | 1.9% |
| Standard Deviation (Population) | 5.7% | 1.9% |
Similar Demographics by Unemployment
Demographics Similar to Dutch West Indians by Unemployment
In terms of unemployment, the demographic groups most similar to Dutch West Indians are French American Indian (5.6%, a difference of 0.020%), Bermudan (5.6%, a difference of 0.070%), Marshallese (5.6%, a difference of 0.15%), Immigrants from Cameroon (5.6%, a difference of 0.21%), and Liberian (5.6%, a difference of 0.34%).
| Demographics | Rating | Rank | Unemployment |
| Moroccans | 3.2 /100 | #237 | Tragic 5.5% |
| Immigrants | Western Asia | 2.8 /100 | #238 | Tragic 5.5% |
| Immigrants | Immigrants | 2.6 /100 | #239 | Tragic 5.5% |
| Cree | 2.6 /100 | #240 | Tragic 5.6% |
| Tlingit-Haida | 2.0 /100 | #241 | Tragic 5.6% |
| Spanish Americans | 2.0 /100 | #242 | Tragic 5.6% |
| Marshallese | 1.3 /100 | #243 | Tragic 5.6% |
| Dutch West Indians | 1.2 /100 | #244 | Tragic 5.6% |
| French American Indians | 1.2 /100 | #245 | Tragic 5.6% |
| Bermudans | 1.1 /100 | #246 | Tragic 5.6% |
| Immigrants | Cameroon | 1.0 /100 | #247 | Tragic 5.6% |
| Liberians | 0.9 /100 | #248 | Tragic 5.6% |
| Cajuns | 0.8 /100 | #249 | Tragic 5.6% |
| Japanese | 0.8 /100 | #250 | Tragic 5.6% |
| Kiowa | 0.6 /100 | #251 | Tragic 5.7% |
Demographics Similar to Immigrants from Saudi Arabia by Unemployment
In terms of unemployment, the demographic groups most similar to Immigrants from Saudi Arabia are Immigrants from Hungary (5.1%, a difference of 0.010%), Pakistani (5.1%, a difference of 0.040%), Immigrants from Spain (5.1%, a difference of 0.070%), Immigrants from Burma/Myanmar (5.1%, a difference of 0.080%), and Immigrants from Europe (5.1%, a difference of 0.090%).
| Demographics | Rating | Rank | Unemployment |
| Iranians | 86.9 /100 | #130 | Excellent 5.1% |
| Immigrants | Croatia | 86.8 /100 | #131 | Excellent 5.1% |
| Immigrants | Ethiopia | 86.7 /100 | #132 | Excellent 5.1% |
| Immigrants | Jordan | 86.6 /100 | #133 | Excellent 5.1% |
| Immigrants | Europe | 86.3 /100 | #134 | Excellent 5.1% |
| Immigrants | Burma/Myanmar | 86.2 /100 | #135 | Excellent 5.1% |
| Immigrants | Spain | 86.2 /100 | #136 | Excellent 5.1% |
| Immigrants | Saudi Arabia | 85.6 /100 | #137 | Excellent 5.1% |
| Immigrants | Hungary | 85.6 /100 | #138 | Excellent 5.1% |
| Pakistanis | 85.3 /100 | #139 | Excellent 5.1% |
| Immigrants | Denmark | 84.3 /100 | #140 | Excellent 5.1% |
| Palestinians | 83.4 /100 | #141 | Excellent 5.1% |
| Immigrants | Pakistan | 83.2 /100 | #142 | Excellent 5.1% |
| Immigrants | Chile | 82.8 /100 | #143 | Excellent 5.1% |
| Indonesians | 82.3 /100 | #144 | Excellent 5.1% |