Kiowa vs Immigrants from Saudi Arabia Unemployment
COMPARE
Kiowa
Immigrants from Saudi Arabia
Unemployment
Unemployment Comparison
Kiowa
Immigrants from Saudi Arabia
5.7%
UNEMPLOYMENT
0.6/ 100
METRIC RATING
251st/ 347
METRIC RANK
5.1%
UNEMPLOYMENT
85.6/ 100
METRIC RATING
137th/ 347
METRIC RANK
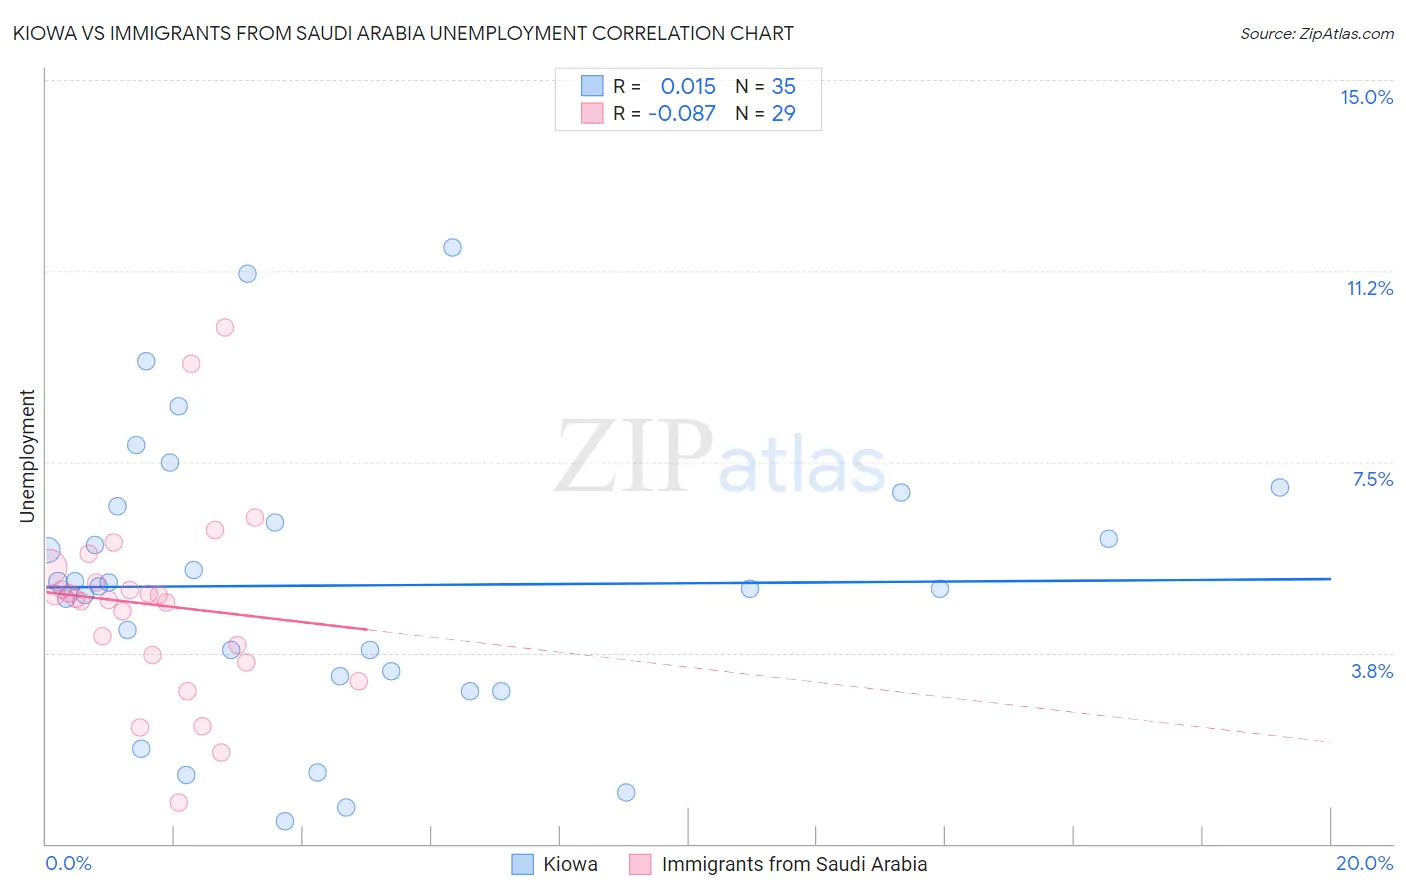
Kiowa vs Immigrants from Saudi Arabia Unemployment Correlation Chart
The statistical analysis conducted on geographies consisting of 56,085,771 people shows no correlation between the proportion of Kiowa and unemployment in the United States with a correlation coefficient (R) of 0.015 and weighted average of 5.7%. Similarly, the statistical analysis conducted on geographies consisting of 164,272,517 people shows a slight negative correlation between the proportion of Immigrants from Saudi Arabia and unemployment in the United States with a correlation coefficient (R) of -0.087 and weighted average of 5.1%, a difference of 11.0%.
Unemployment Correlation Summary
| Measurement | Kiowa | Immigrants from Saudi Arabia |
| Minimum | 0.44% | 0.80% |
| Maximum | 11.7% | 10.1% |
| Range | 11.3% | 9.3% |
| Mean | 5.1% | 4.7% |
| Median | 5.1% | 4.8% |
| Interquartile 25% (IQ1) | 3.3% | 3.6% |
| Interquartile 75% (IQ3) | 6.6% | 5.3% |
| Interquartile Range (IQR) | 3.3% | 1.6% |
| Standard Deviation (Sample) | 2.7% | 1.9% |
| Standard Deviation (Population) | 2.7% | 1.9% |
Similar Demographics by Unemployment
Demographics Similar to Kiowa by Unemployment
In terms of unemployment, the demographic groups most similar to Kiowa are Japanese (5.6%, a difference of 0.47%), Cajun (5.6%, a difference of 0.48%), Liberian (5.6%, a difference of 0.74%), Honduran (5.7%, a difference of 0.74%), and Central American (5.7%, a difference of 0.75%).
| Demographics | Rating | Rank | Unemployment |
| Dutch West Indians | 1.2 /100 | #244 | Tragic 5.6% |
| French American Indians | 1.2 /100 | #245 | Tragic 5.6% |
| Bermudans | 1.1 /100 | #246 | Tragic 5.6% |
| Immigrants | Cameroon | 1.0 /100 | #247 | Tragic 5.6% |
| Liberians | 0.9 /100 | #248 | Tragic 5.6% |
| Cajuns | 0.8 /100 | #249 | Tragic 5.6% |
| Japanese | 0.8 /100 | #250 | Tragic 5.6% |
| Kiowa | 0.6 /100 | #251 | Tragic 5.7% |
| Hondurans | 0.3 /100 | #252 | Tragic 5.7% |
| Central Americans | 0.3 /100 | #253 | Tragic 5.7% |
| Immigrants | Honduras | 0.3 /100 | #254 | Tragic 5.7% |
| Immigrants | Portugal | 0.2 /100 | #255 | Tragic 5.7% |
| Guatemalans | 0.2 /100 | #256 | Tragic 5.8% |
| Yaqui | 0.2 /100 | #257 | Tragic 5.8% |
| Immigrants | Bahamas | 0.1 /100 | #258 | Tragic 5.8% |
Demographics Similar to Immigrants from Saudi Arabia by Unemployment
In terms of unemployment, the demographic groups most similar to Immigrants from Saudi Arabia are Immigrants from Hungary (5.1%, a difference of 0.010%), Pakistani (5.1%, a difference of 0.040%), Immigrants from Spain (5.1%, a difference of 0.070%), Immigrants from Burma/Myanmar (5.1%, a difference of 0.080%), and Immigrants from Europe (5.1%, a difference of 0.090%).
| Demographics | Rating | Rank | Unemployment |
| Iranians | 86.9 /100 | #130 | Excellent 5.1% |
| Immigrants | Croatia | 86.8 /100 | #131 | Excellent 5.1% |
| Immigrants | Ethiopia | 86.7 /100 | #132 | Excellent 5.1% |
| Immigrants | Jordan | 86.6 /100 | #133 | Excellent 5.1% |
| Immigrants | Europe | 86.3 /100 | #134 | Excellent 5.1% |
| Immigrants | Burma/Myanmar | 86.2 /100 | #135 | Excellent 5.1% |
| Immigrants | Spain | 86.2 /100 | #136 | Excellent 5.1% |
| Immigrants | Saudi Arabia | 85.6 /100 | #137 | Excellent 5.1% |
| Immigrants | Hungary | 85.6 /100 | #138 | Excellent 5.1% |
| Pakistanis | 85.3 /100 | #139 | Excellent 5.1% |
| Immigrants | Denmark | 84.3 /100 | #140 | Excellent 5.1% |
| Palestinians | 83.4 /100 | #141 | Excellent 5.1% |
| Immigrants | Pakistan | 83.2 /100 | #142 | Excellent 5.1% |
| Immigrants | Chile | 82.8 /100 | #143 | Excellent 5.1% |
| Indonesians | 82.3 /100 | #144 | Excellent 5.1% |