Chinese vs Pima Female Unemployment
COMPARE
Chinese
Pima
Female Unemployment
Female Unemployment Comparison
Chinese
Pima
4.5%
FEMALE UNEMPLOYMENT
100.0/ 100
METRIC RATING
7th/ 347
METRIC RANK
9.3%
FEMALE UNEMPLOYMENT
0.0/ 100
METRIC RATING
344th/ 347
METRIC RANK
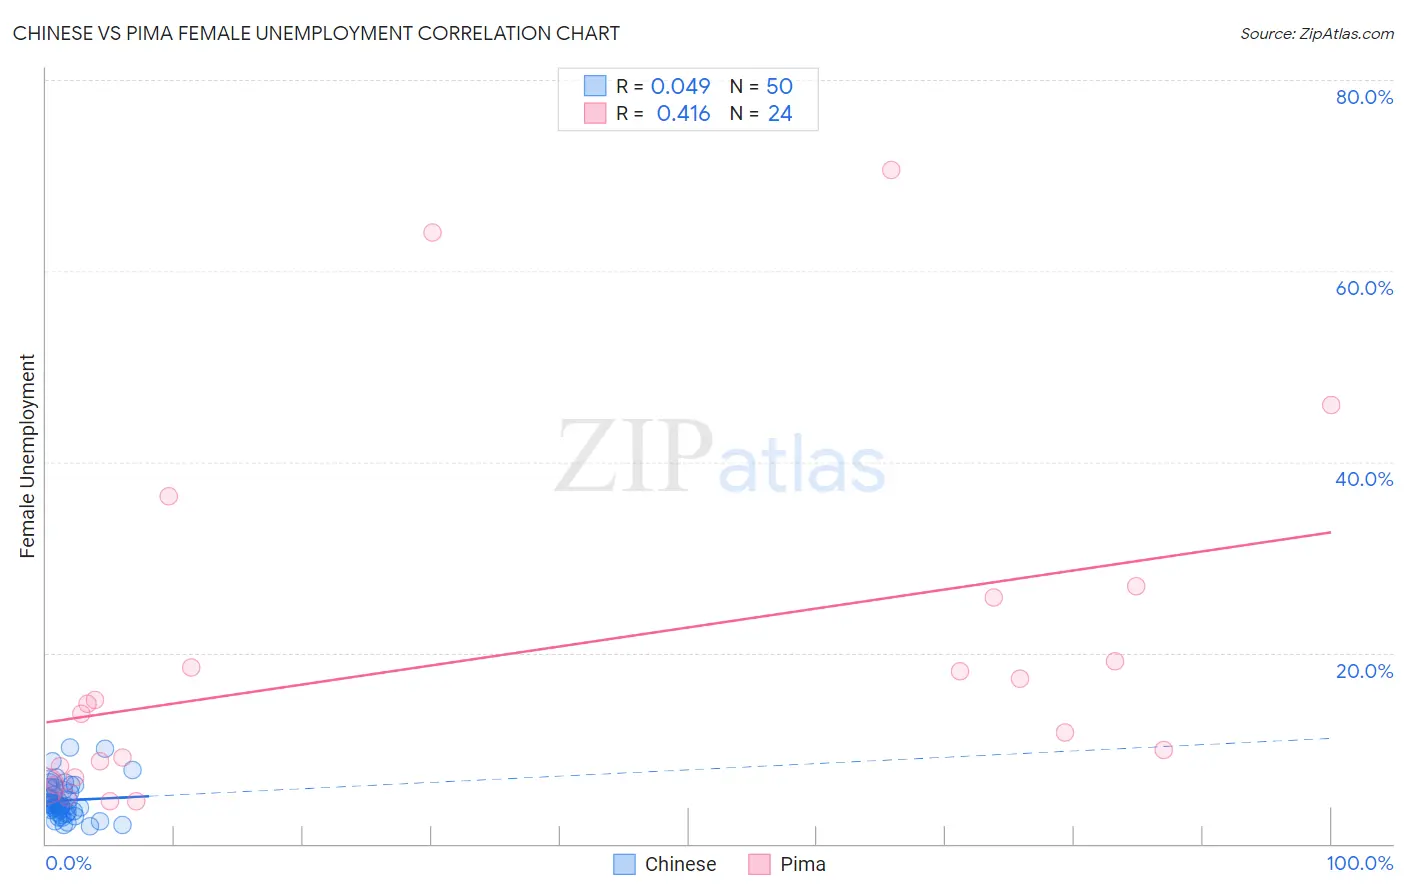
Chinese vs Pima Female Unemployment Correlation Chart
The statistical analysis conducted on geographies consisting of 64,725,695 people shows no correlation between the proportion of Chinese and unemploymnet rate among females in the United States with a correlation coefficient (R) of 0.049 and weighted average of 4.5%. Similarly, the statistical analysis conducted on geographies consisting of 61,489,621 people shows a moderate positive correlation between the proportion of Pima and unemploymnet rate among females in the United States with a correlation coefficient (R) of 0.416 and weighted average of 9.3%, a difference of 108.1%.
Female Unemployment Correlation Summary
| Measurement | Chinese | Pima |
| Minimum | 1.8% | 4.5% |
| Maximum | 10.0% | 70.6% |
| Range | 8.2% | 66.1% |
| Mean | 4.5% | 19.4% |
| Median | 4.1% | 14.2% |
| Interquartile 25% (IQ1) | 3.3% | 7.5% |
| Interquartile 75% (IQ3) | 5.8% | 22.5% |
| Interquartile Range (IQR) | 2.5% | 14.9% |
| Standard Deviation (Sample) | 1.9% | 18.0% |
| Standard Deviation (Population) | 1.9% | 17.6% |
Similar Demographics by Female Unemployment
Demographics Similar to Chinese by Female Unemployment
In terms of female unemployment, the demographic groups most similar to Chinese are German (4.5%, a difference of 0.020%), Slovene (4.5%, a difference of 0.38%), Swedish (4.4%, a difference of 0.77%), Swiss (4.6%, a difference of 1.7%), and Scandinavian (4.6%, a difference of 1.8%).
| Demographics | Rating | Rank | Female Unemployment |
| Norwegians | 100.0 /100 | #1 | Exceptional 4.2% |
| Czechs | 100.0 /100 | #2 | Exceptional 4.4% |
| Luxembourgers | 100.0 /100 | #3 | Exceptional 4.4% |
| Danes | 100.0 /100 | #4 | Exceptional 4.4% |
| Hmong | 100.0 /100 | #5 | Exceptional 4.4% |
| Swedes | 100.0 /100 | #6 | Exceptional 4.4% |
| Chinese | 100.0 /100 | #7 | Exceptional 4.5% |
| Germans | 100.0 /100 | #8 | Exceptional 4.5% |
| Slovenes | 100.0 /100 | #9 | Exceptional 4.5% |
| Swiss | 100.0 /100 | #10 | Exceptional 4.6% |
| Scandinavians | 100.0 /100 | #11 | Exceptional 4.6% |
| Dutch | 100.0 /100 | #12 | Exceptional 4.6% |
| Belgians | 100.0 /100 | #13 | Exceptional 4.6% |
| Finns | 100.0 /100 | #14 | Exceptional 4.6% |
| English | 100.0 /100 | #15 | Exceptional 4.6% |
Demographics Similar to Pima by Female Unemployment
In terms of female unemployment, the demographic groups most similar to Pima are Yuman (9.6%, a difference of 2.8%), Arapaho (8.8%, a difference of 6.2%), Puerto Rican (8.3%, a difference of 11.9%), Inupiat (8.2%, a difference of 14.4%), and Hopi (8.1%, a difference of 15.3%).
| Demographics | Rating | Rank | Female Unemployment |
| Menominee | 0.0 /100 | #333 | Tragic 7.0% |
| Immigrants | Armenia | 0.0 /100 | #334 | Tragic 7.1% |
| Dominicans | 0.0 /100 | #335 | Tragic 7.2% |
| Immigrants | Dominican Republic | 0.0 /100 | #336 | Tragic 7.2% |
| Navajo | 0.0 /100 | #337 | Tragic 7.3% |
| Tohono O'odham | 0.0 /100 | #338 | Tragic 7.7% |
| Immigrants | Yemen | 0.0 /100 | #339 | Tragic 7.8% |
| Hopi | 0.0 /100 | #340 | Tragic 8.1% |
| Inupiat | 0.0 /100 | #341 | Tragic 8.2% |
| Puerto Ricans | 0.0 /100 | #342 | Tragic 8.3% |
| Arapaho | 0.0 /100 | #343 | Tragic 8.8% |
| Pima | 0.0 /100 | #344 | Tragic 9.3% |
| Yuman | 0.0 /100 | #345 | Tragic 9.6% |
| Yup'ik | 0.0 /100 | #346 | Tragic 10.9% |
| Crow | 0.0 /100 | #347 | Tragic 12.1% |