Immigrants from Afghanistan vs Yaqui Female Unemployment
COMPARE
Immigrants from Afghanistan
Yaqui
Female Unemployment
Female Unemployment Comparison
Immigrants from Afghanistan
Yaqui
5.4%
FEMALE UNEMPLOYMENT
18.9/ 100
METRIC RATING
205th/ 347
METRIC RANK
6.0%
FEMALE UNEMPLOYMENT
0.0/ 100
METRIC RATING
278th/ 347
METRIC RANK
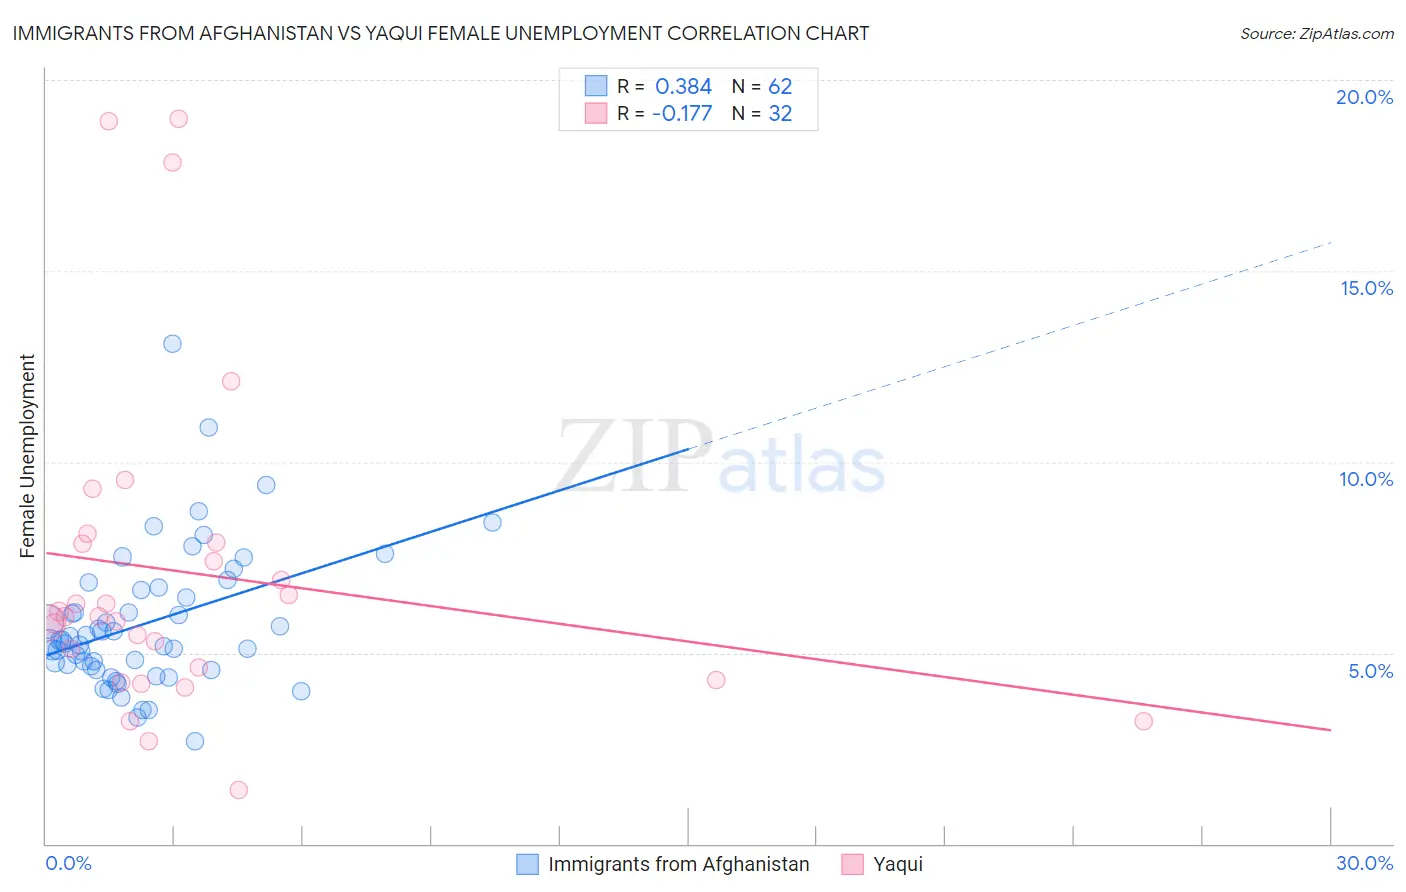
Immigrants from Afghanistan vs Yaqui Female Unemployment Correlation Chart
The statistical analysis conducted on geographies consisting of 147,540,381 people shows a mild positive correlation between the proportion of Immigrants from Afghanistan and unemploymnet rate among females in the United States with a correlation coefficient (R) of 0.384 and weighted average of 5.4%. Similarly, the statistical analysis conducted on geographies consisting of 107,534,058 people shows a poor negative correlation between the proportion of Yaqui and unemploymnet rate among females in the United States with a correlation coefficient (R) of -0.177 and weighted average of 6.0%, a difference of 11.8%.
Female Unemployment Correlation Summary
| Measurement | Immigrants from Afghanistan | Yaqui |
| Minimum | 2.7% | 1.4% |
| Maximum | 13.1% | 19.0% |
| Range | 10.4% | 17.6% |
| Mean | 5.8% | 7.1% |
| Median | 5.3% | 5.9% |
| Interquartile 25% (IQ1) | 4.6% | 4.5% |
| Interquartile 75% (IQ3) | 6.6% | 7.9% |
| Interquartile Range (IQR) | 2.0% | 3.4% |
| Standard Deviation (Sample) | 1.8% | 4.3% |
| Standard Deviation (Population) | 1.8% | 4.2% |
Similar Demographics by Female Unemployment
Demographics Similar to Immigrants from Afghanistan by Female Unemployment
In terms of female unemployment, the demographic groups most similar to Immigrants from Afghanistan are Immigrants from Brazil (5.4%, a difference of 0.020%), Immigrants from Israel (5.4%, a difference of 0.070%), Immigrants from South Eastern Asia (5.4%, a difference of 0.13%), Immigrants from Middle Africa (5.4%, a difference of 0.18%), and Iroquois (5.4%, a difference of 0.18%).
| Demographics | Rating | Rank | Female Unemployment |
| Tsimshian | 23.1 /100 | #198 | Fair 5.4% |
| Hawaiians | 22.2 /100 | #199 | Fair 5.4% |
| Soviet Union | 21.7 /100 | #200 | Fair 5.4% |
| Immigrants | Middle Africa | 20.8 /100 | #201 | Fair 5.4% |
| Iroquois | 20.8 /100 | #202 | Fair 5.4% |
| Immigrants | South Eastern Asia | 20.3 /100 | #203 | Fair 5.4% |
| Immigrants | Israel | 19.7 /100 | #204 | Poor 5.4% |
| Immigrants | Afghanistan | 18.9 /100 | #205 | Poor 5.4% |
| Immigrants | Brazil | 18.8 /100 | #206 | Poor 5.4% |
| Creek | 15.4 /100 | #207 | Poor 5.4% |
| Immigrants | Costa Rica | 13.7 /100 | #208 | Poor 5.4% |
| Koreans | 13.4 /100 | #209 | Poor 5.4% |
| Choctaw | 12.3 /100 | #210 | Poor 5.4% |
| Ottawa | 11.6 /100 | #211 | Poor 5.4% |
| Uruguayans | 11.4 /100 | #212 | Poor 5.4% |
Demographics Similar to Yaqui by Female Unemployment
In terms of female unemployment, the demographic groups most similar to Yaqui are Immigrants from Ghana (6.0%, a difference of 0.0%), Armenian (6.0%, a difference of 0.11%), Mexican American Indian (6.0%, a difference of 0.17%), Guatemalan (6.0%, a difference of 0.21%), and Bahamian (6.0%, a difference of 0.40%).
| Demographics | Rating | Rank | Female Unemployment |
| Central Americans | 0.0 /100 | #271 | Tragic 5.9% |
| Lumbee | 0.0 /100 | #272 | Tragic 5.9% |
| Ghanaians | 0.0 /100 | #273 | Tragic 5.9% |
| Africans | 0.0 /100 | #274 | Tragic 5.9% |
| Senegalese | 0.0 /100 | #275 | Tragic 6.0% |
| Bahamians | 0.0 /100 | #276 | Tragic 6.0% |
| Immigrants | Ghana | 0.0 /100 | #277 | Tragic 6.0% |
| Yaqui | 0.0 /100 | #278 | Tragic 6.0% |
| Armenians | 0.0 /100 | #279 | Tragic 6.0% |
| Mexican American Indians | 0.0 /100 | #280 | Tragic 6.0% |
| Guatemalans | 0.0 /100 | #281 | Tragic 6.0% |
| Colville | 0.0 /100 | #282 | Tragic 6.0% |
| Salvadorans | 0.0 /100 | #283 | Tragic 6.0% |
| Immigrants | Senegal | 0.0 /100 | #284 | Tragic 6.1% |
| Immigrants | Cabo Verde | 0.0 /100 | #285 | Tragic 6.1% |