Immigrants from Afghanistan vs Carpatho Rusyn Female Unemployment
COMPARE
Immigrants from Afghanistan
Carpatho Rusyn
Female Unemployment
Female Unemployment Comparison
Immigrants from Afghanistan
Carpatho Rusyns
5.4%
FEMALE UNEMPLOYMENT
18.9/ 100
METRIC RATING
205th/ 347
METRIC RANK
4.7%
FEMALE UNEMPLOYMENT
99.9/ 100
METRIC RATING
16th/ 347
METRIC RANK
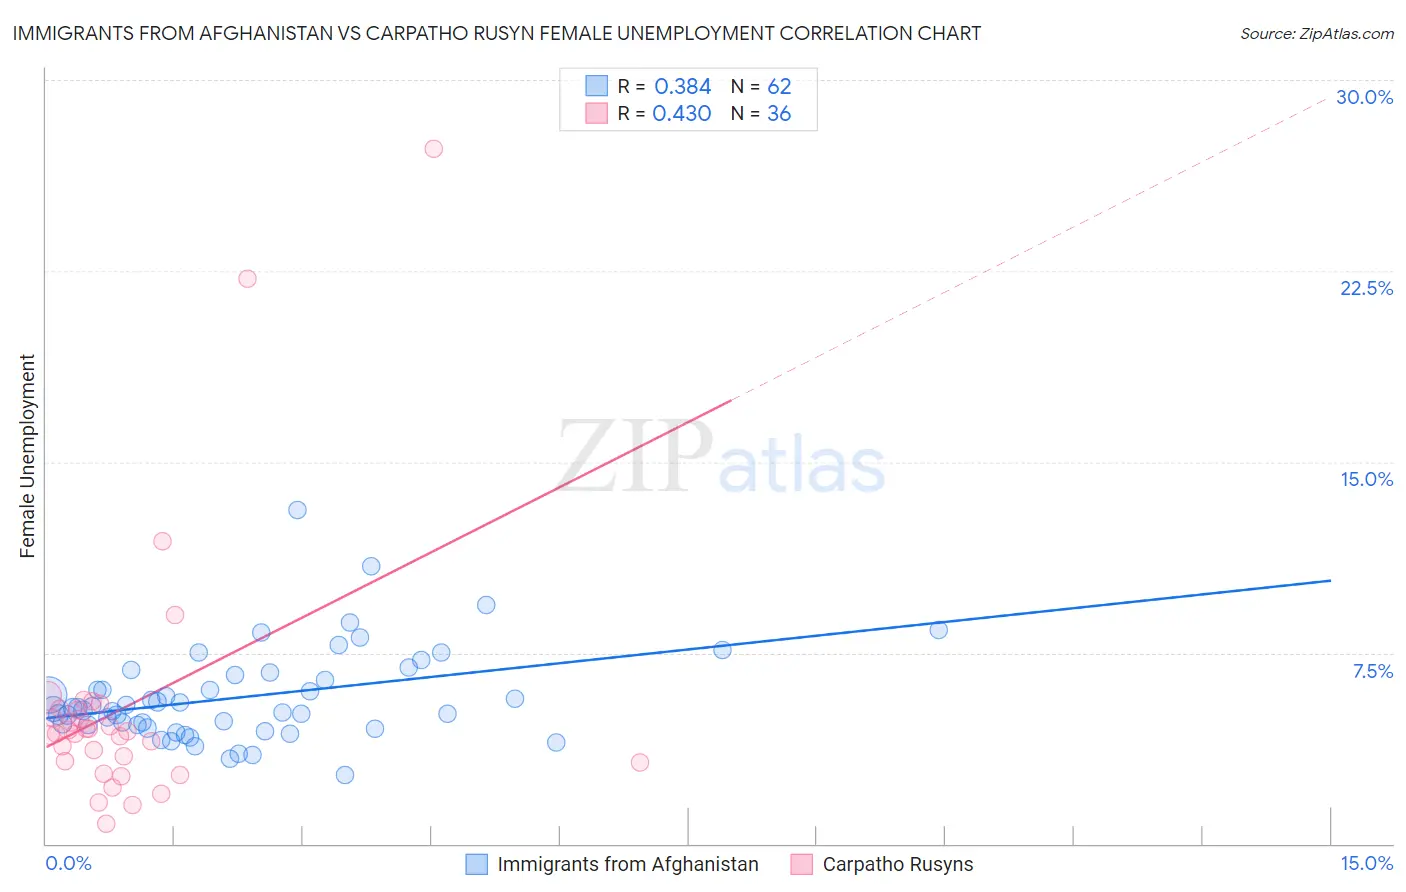
Immigrants from Afghanistan vs Carpatho Rusyn Female Unemployment Correlation Chart
The statistical analysis conducted on geographies consisting of 147,540,381 people shows a mild positive correlation between the proportion of Immigrants from Afghanistan and unemploymnet rate among females in the United States with a correlation coefficient (R) of 0.384 and weighted average of 5.4%. Similarly, the statistical analysis conducted on geographies consisting of 58,788,247 people shows a moderate positive correlation between the proportion of Carpatho Rusyns and unemploymnet rate among females in the United States with a correlation coefficient (R) of 0.430 and weighted average of 4.7%, a difference of 14.9%.
Female Unemployment Correlation Summary
| Measurement | Immigrants from Afghanistan | Carpatho Rusyn |
| Minimum | 2.7% | 0.80% |
| Maximum | 13.1% | 27.3% |
| Range | 10.4% | 26.5% |
| Mean | 5.8% | 5.4% |
| Median | 5.3% | 4.4% |
| Interquartile 25% (IQ1) | 4.6% | 3.2% |
| Interquartile 75% (IQ3) | 6.6% | 5.3% |
| Interquartile Range (IQR) | 2.0% | 2.1% |
| Standard Deviation (Sample) | 1.8% | 5.2% |
| Standard Deviation (Population) | 1.8% | 5.1% |
Similar Demographics by Female Unemployment
Demographics Similar to Immigrants from Afghanistan by Female Unemployment
In terms of female unemployment, the demographic groups most similar to Immigrants from Afghanistan are Immigrants from Brazil (5.4%, a difference of 0.020%), Immigrants from Israel (5.4%, a difference of 0.070%), Immigrants from South Eastern Asia (5.4%, a difference of 0.13%), Immigrants from Middle Africa (5.4%, a difference of 0.18%), and Iroquois (5.4%, a difference of 0.18%).
| Demographics | Rating | Rank | Female Unemployment |
| Tsimshian | 23.1 /100 | #198 | Fair 5.4% |
| Hawaiians | 22.2 /100 | #199 | Fair 5.4% |
| Soviet Union | 21.7 /100 | #200 | Fair 5.4% |
| Immigrants | Middle Africa | 20.8 /100 | #201 | Fair 5.4% |
| Iroquois | 20.8 /100 | #202 | Fair 5.4% |
| Immigrants | South Eastern Asia | 20.3 /100 | #203 | Fair 5.4% |
| Immigrants | Israel | 19.7 /100 | #204 | Poor 5.4% |
| Immigrants | Afghanistan | 18.9 /100 | #205 | Poor 5.4% |
| Immigrants | Brazil | 18.8 /100 | #206 | Poor 5.4% |
| Creek | 15.4 /100 | #207 | Poor 5.4% |
| Immigrants | Costa Rica | 13.7 /100 | #208 | Poor 5.4% |
| Koreans | 13.4 /100 | #209 | Poor 5.4% |
| Choctaw | 12.3 /100 | #210 | Poor 5.4% |
| Ottawa | 11.6 /100 | #211 | Poor 5.4% |
| Uruguayans | 11.4 /100 | #212 | Poor 5.4% |
Demographics Similar to Carpatho Rusyns by Female Unemployment
In terms of female unemployment, the demographic groups most similar to Carpatho Rusyns are Croatian (4.7%, a difference of 0.020%), Latvian (4.7%, a difference of 0.16%), Polish (4.7%, a difference of 0.17%), Bulgarian (4.7%, a difference of 0.25%), and Fijian (4.7%, a difference of 0.27%).
| Demographics | Rating | Rank | Female Unemployment |
| Slovenes | 100.0 /100 | #9 | Exceptional 4.5% |
| Swiss | 100.0 /100 | #10 | Exceptional 4.6% |
| Scandinavians | 100.0 /100 | #11 | Exceptional 4.6% |
| Dutch | 100.0 /100 | #12 | Exceptional 4.6% |
| Belgians | 100.0 /100 | #13 | Exceptional 4.6% |
| Finns | 100.0 /100 | #14 | Exceptional 4.6% |
| English | 100.0 /100 | #15 | Exceptional 4.6% |
| Carpatho Rusyns | 99.9 /100 | #16 | Exceptional 4.7% |
| Croatians | 99.9 /100 | #17 | Exceptional 4.7% |
| Latvians | 99.9 /100 | #18 | Exceptional 4.7% |
| Poles | 99.9 /100 | #19 | Exceptional 4.7% |
| Bulgarians | 99.9 /100 | #20 | Exceptional 4.7% |
| Fijians | 99.9 /100 | #21 | Exceptional 4.7% |
| Europeans | 99.9 /100 | #22 | Exceptional 4.7% |
| Scottish | 99.9 /100 | #23 | Exceptional 4.7% |