Houma vs Immigrants from Portugal Male Unemployment
COMPARE
Houma
Immigrants from Portugal
Male Unemployment
Male Unemployment Comparison
Houma
Immigrants from Portugal
7.1%
MALE UNEMPLOYMENT
0.0/ 100
METRIC RATING
315th/ 347
METRIC RANK
5.9%
MALE UNEMPLOYMENT
0.1/ 100
METRIC RATING
262nd/ 347
METRIC RANK
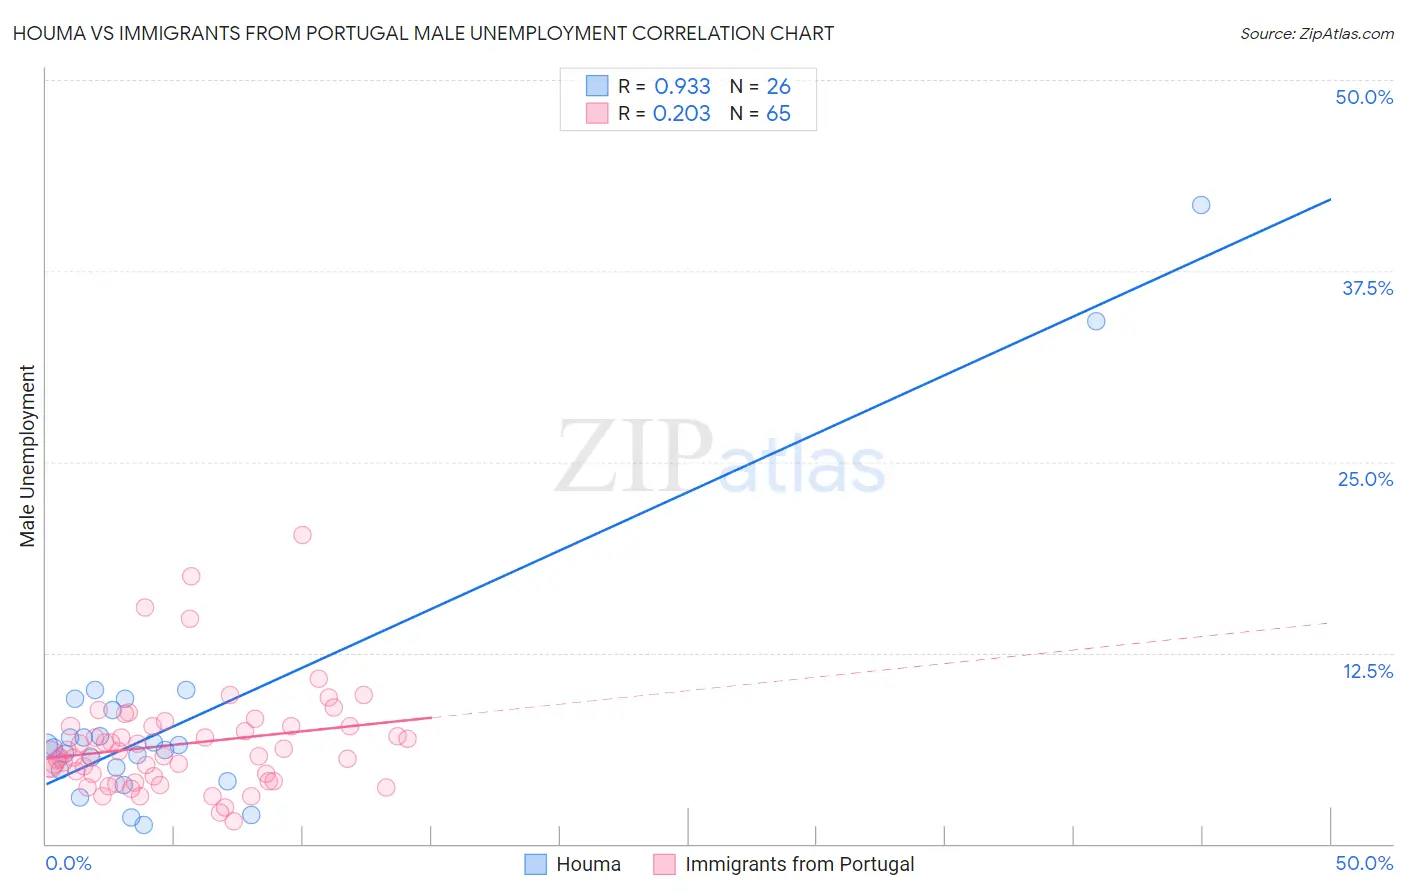
Houma vs Immigrants from Portugal Male Unemployment Correlation Chart
The statistical analysis conducted on geographies consisting of 36,684,970 people shows a near-perfect positive correlation between the proportion of Houma and unemployment rate among males in the United States with a correlation coefficient (R) of 0.933 and weighted average of 7.1%. Similarly, the statistical analysis conducted on geographies consisting of 174,523,073 people shows a weak positive correlation between the proportion of Immigrants from Portugal and unemployment rate among males in the United States with a correlation coefficient (R) of 0.203 and weighted average of 5.9%, a difference of 21.3%.
Male Unemployment Correlation Summary
| Measurement | Houma | Immigrants from Portugal |
| Minimum | 1.2% | 1.5% |
| Maximum | 41.8% | 20.2% |
| Range | 40.6% | 18.7% |
| Mean | 8.4% | 6.5% |
| Median | 6.4% | 5.7% |
| Interquartile 25% (IQ1) | 4.8% | 4.2% |
| Interquartile 75% (IQ3) | 8.8% | 7.7% |
| Interquartile Range (IQR) | 4.0% | 3.4% |
| Standard Deviation (Sample) | 9.1% | 3.4% |
| Standard Deviation (Population) | 8.9% | 3.4% |
Similar Demographics by Male Unemployment
Demographics Similar to Houma by Male Unemployment
In terms of male unemployment, the demographic groups most similar to Houma are Immigrants from Guyana (7.1%, a difference of 0.030%), Guyanese (7.1%, a difference of 0.080%), Cape Verdean (7.1%, a difference of 0.15%), Immigrants from Barbados (7.1%, a difference of 0.21%), and Immigrants from Dominica (7.0%, a difference of 1.5%).
| Demographics | Rating | Rank | Male Unemployment |
| Aleuts | 0.0 /100 | #308 | Tragic 6.8% |
| Barbadians | 0.0 /100 | #309 | Tragic 6.9% |
| Blacks/African Americans | 0.0 /100 | #310 | Tragic 6.9% |
| Immigrants | Armenia | 0.0 /100 | #311 | Tragic 6.9% |
| Lumbee | 0.0 /100 | #312 | Tragic 6.9% |
| Immigrants | Dominica | 0.0 /100 | #313 | Tragic 7.0% |
| Immigrants | Barbados | 0.0 /100 | #314 | Tragic 7.1% |
| Houma | 0.0 /100 | #315 | Tragic 7.1% |
| Immigrants | Guyana | 0.0 /100 | #316 | Tragic 7.1% |
| Guyanese | 0.0 /100 | #317 | Tragic 7.1% |
| Cape Verdeans | 0.0 /100 | #318 | Tragic 7.1% |
| British West Indians | 0.0 /100 | #319 | Tragic 7.3% |
| Colville | 0.0 /100 | #320 | Tragic 7.4% |
| Immigrants | St. Vincent and the Grenadines | 0.0 /100 | #321 | Tragic 7.5% |
| Immigrants | Cabo Verde | 0.0 /100 | #322 | Tragic 7.5% |
Demographics Similar to Immigrants from Portugal by Male Unemployment
In terms of male unemployment, the demographic groups most similar to Immigrants from Portugal are Immigrants from Latin America (5.9%, a difference of 0.24%), Liberian (5.8%, a difference of 0.45%), Immigrants from Mexico (5.9%, a difference of 0.46%), Immigrants from Central America (5.8%, a difference of 0.63%), and Cajun (5.8%, a difference of 0.69%).
| Demographics | Rating | Rank | Male Unemployment |
| Kiowa | 0.2 /100 | #255 | Tragic 5.8% |
| Comanche | 0.2 /100 | #256 | Tragic 5.8% |
| Hispanics or Latinos | 0.1 /100 | #257 | Tragic 5.8% |
| Dutch West Indians | 0.1 /100 | #258 | Tragic 5.8% |
| Cajuns | 0.1 /100 | #259 | Tragic 5.8% |
| Immigrants | Central America | 0.1 /100 | #260 | Tragic 5.8% |
| Liberians | 0.1 /100 | #261 | Tragic 5.8% |
| Immigrants | Portugal | 0.1 /100 | #262 | Tragic 5.9% |
| Immigrants | Latin America | 0.1 /100 | #263 | Tragic 5.9% |
| Immigrants | Mexico | 0.0 /100 | #264 | Tragic 5.9% |
| French American Indians | 0.0 /100 | #265 | Tragic 5.9% |
| Bahamians | 0.0 /100 | #266 | Tragic 5.9% |
| Nigerians | 0.0 /100 | #267 | Tragic 5.9% |
| Bermudans | 0.0 /100 | #268 | Tragic 5.9% |
| Immigrants | Nigeria | 0.0 /100 | #269 | Tragic 6.0% |