Ugandan vs Immigrants from Portugal Male Unemployment
COMPARE
Ugandan
Immigrants from Portugal
Male Unemployment
Male Unemployment Comparison
Ugandans
Immigrants from Portugal
5.5%
MALE UNEMPLOYMENT
6.3/ 100
METRIC RATING
213th/ 347
METRIC RANK
5.9%
MALE UNEMPLOYMENT
0.1/ 100
METRIC RATING
262nd/ 347
METRIC RANK
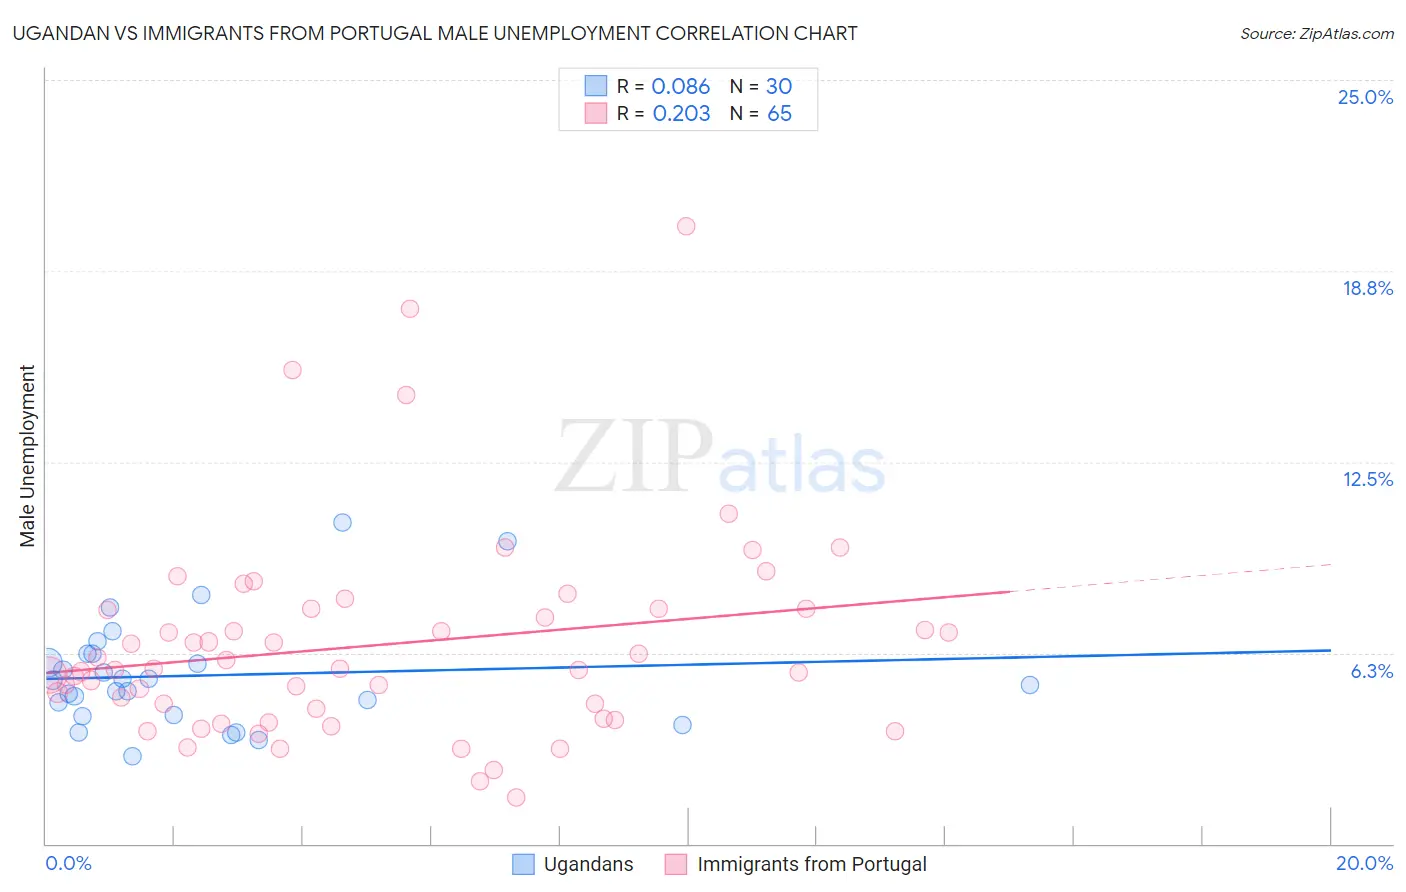
Ugandan vs Immigrants from Portugal Male Unemployment Correlation Chart
The statistical analysis conducted on geographies consisting of 93,962,786 people shows a slight positive correlation between the proportion of Ugandans and unemployment rate among males in the United States with a correlation coefficient (R) of 0.086 and weighted average of 5.5%. Similarly, the statistical analysis conducted on geographies consisting of 174,523,073 people shows a weak positive correlation between the proportion of Immigrants from Portugal and unemployment rate among males in the United States with a correlation coefficient (R) of 0.203 and weighted average of 5.9%, a difference of 6.5%.
Male Unemployment Correlation Summary
| Measurement | Ugandan | Immigrants from Portugal |
| Minimum | 2.8% | 1.5% |
| Maximum | 10.5% | 20.2% |
| Range | 7.7% | 18.7% |
| Mean | 5.5% | 6.5% |
| Median | 5.3% | 5.7% |
| Interquartile 25% (IQ1) | 4.2% | 4.2% |
| Interquartile 75% (IQ3) | 6.2% | 7.7% |
| Interquartile Range (IQR) | 2.0% | 3.4% |
| Standard Deviation (Sample) | 1.8% | 3.4% |
| Standard Deviation (Population) | 1.8% | 3.4% |
Similar Demographics by Male Unemployment
Demographics Similar to Ugandans by Male Unemployment
In terms of male unemployment, the demographic groups most similar to Ugandans are Hmong (5.5%, a difference of 0.16%), Puget Sound Salish (5.5%, a difference of 0.17%), Israeli (5.5%, a difference of 0.25%), South American Indian (5.5%, a difference of 0.30%), and Samoan (5.5%, a difference of 0.37%).
| Demographics | Rating | Rank | Male Unemployment |
| Immigrants | Ukraine | 9.9 /100 | #206 | Tragic 5.5% |
| Immigrants | Syria | 9.3 /100 | #207 | Tragic 5.5% |
| Immigrants | Lebanon | 8.6 /100 | #208 | Tragic 5.5% |
| Immigrants | Middle Africa | 8.3 /100 | #209 | Tragic 5.5% |
| South American Indians | 7.6 /100 | #210 | Tragic 5.5% |
| Israelis | 7.4 /100 | #211 | Tragic 5.5% |
| Hmong | 7.0 /100 | #212 | Tragic 5.5% |
| Ugandans | 6.3 /100 | #213 | Tragic 5.5% |
| Puget Sound Salish | 5.6 /100 | #214 | Tragic 5.5% |
| Samoans | 4.9 /100 | #215 | Tragic 5.5% |
| Immigrants | Immigrants | 4.3 /100 | #216 | Tragic 5.5% |
| Delaware | 4.2 /100 | #217 | Tragic 5.5% |
| Immigrants | Albania | 3.6 /100 | #218 | Tragic 5.5% |
| Immigrants | Western Asia | 3.5 /100 | #219 | Tragic 5.6% |
| Portuguese | 3.5 /100 | #220 | Tragic 5.6% |
Demographics Similar to Immigrants from Portugal by Male Unemployment
In terms of male unemployment, the demographic groups most similar to Immigrants from Portugal are Immigrants from Latin America (5.9%, a difference of 0.24%), Liberian (5.8%, a difference of 0.45%), Immigrants from Mexico (5.9%, a difference of 0.46%), Immigrants from Central America (5.8%, a difference of 0.63%), and Cajun (5.8%, a difference of 0.69%).
| Demographics | Rating | Rank | Male Unemployment |
| Kiowa | 0.2 /100 | #255 | Tragic 5.8% |
| Comanche | 0.2 /100 | #256 | Tragic 5.8% |
| Hispanics or Latinos | 0.1 /100 | #257 | Tragic 5.8% |
| Dutch West Indians | 0.1 /100 | #258 | Tragic 5.8% |
| Cajuns | 0.1 /100 | #259 | Tragic 5.8% |
| Immigrants | Central America | 0.1 /100 | #260 | Tragic 5.8% |
| Liberians | 0.1 /100 | #261 | Tragic 5.8% |
| Immigrants | Portugal | 0.1 /100 | #262 | Tragic 5.9% |
| Immigrants | Latin America | 0.1 /100 | #263 | Tragic 5.9% |
| Immigrants | Mexico | 0.0 /100 | #264 | Tragic 5.9% |
| French American Indians | 0.0 /100 | #265 | Tragic 5.9% |
| Bahamians | 0.0 /100 | #266 | Tragic 5.9% |
| Nigerians | 0.0 /100 | #267 | Tragic 5.9% |
| Bermudans | 0.0 /100 | #268 | Tragic 5.9% |
| Immigrants | Nigeria | 0.0 /100 | #269 | Tragic 6.0% |