Houma vs Immigrants from Bosnia and Herzegovina Male Unemployment
COMPARE
Houma
Immigrants from Bosnia and Herzegovina
Male Unemployment
Male Unemployment Comparison
Houma
Immigrants from Bosnia and Herzegovina
7.1%
MALE UNEMPLOYMENT
0.0/ 100
METRIC RATING
315th/ 347
METRIC RANK
4.9%
MALE UNEMPLOYMENT
99.4/ 100
METRIC RATING
38th/ 347
METRIC RANK
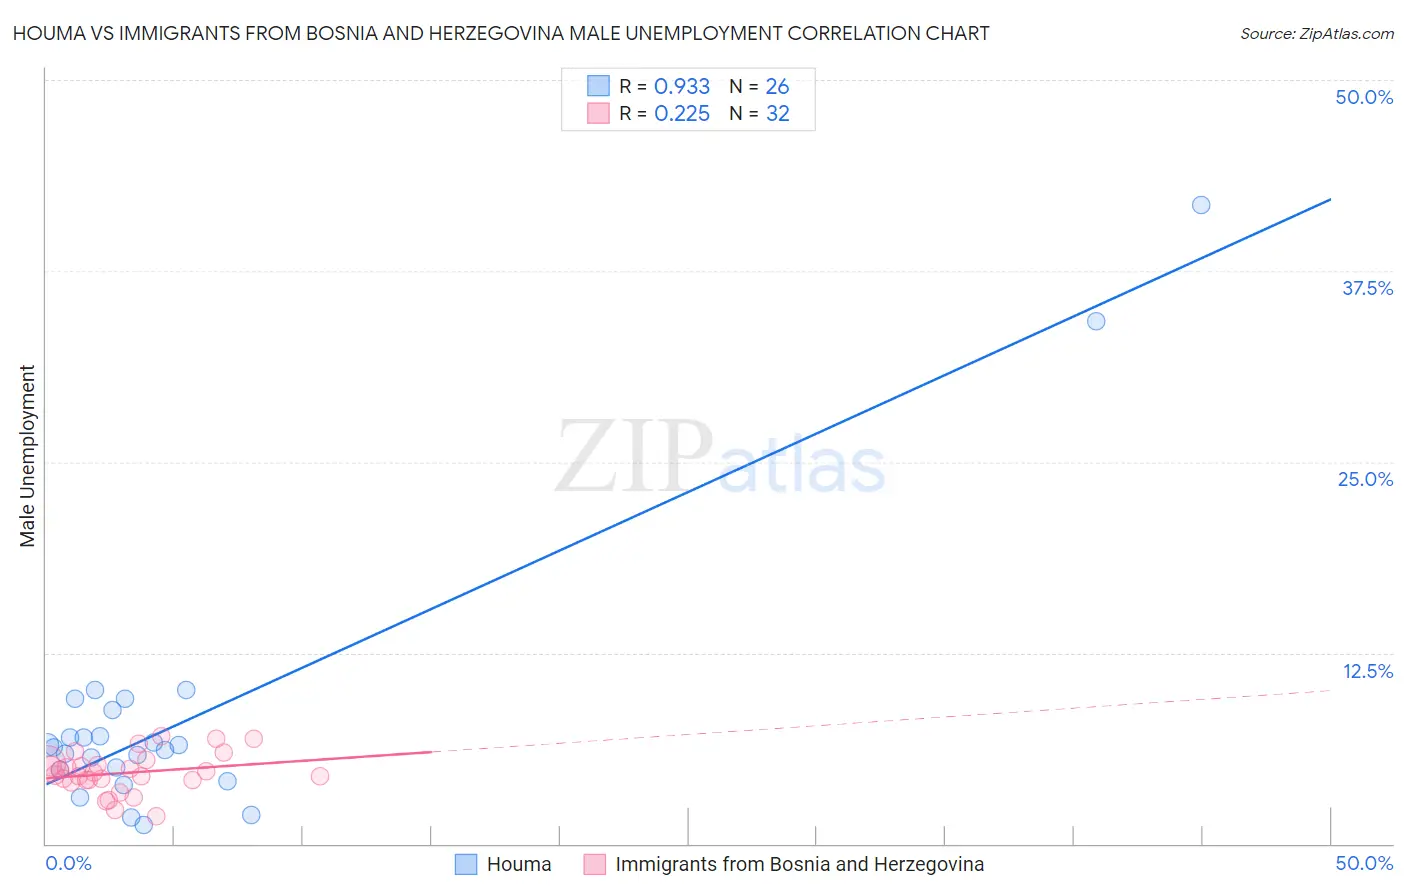
Houma vs Immigrants from Bosnia and Herzegovina Male Unemployment Correlation Chart
The statistical analysis conducted on geographies consisting of 36,684,970 people shows a near-perfect positive correlation between the proportion of Houma and unemployment rate among males in the United States with a correlation coefficient (R) of 0.933 and weighted average of 7.1%. Similarly, the statistical analysis conducted on geographies consisting of 156,632,183 people shows a weak positive correlation between the proportion of Immigrants from Bosnia and Herzegovina and unemployment rate among males in the United States with a correlation coefficient (R) of 0.225 and weighted average of 4.9%, a difference of 44.9%.
Male Unemployment Correlation Summary
| Measurement | Houma | Immigrants from Bosnia and Herzegovina |
| Minimum | 1.2% | 1.8% |
| Maximum | 41.8% | 7.0% |
| Range | 40.6% | 5.2% |
| Mean | 8.4% | 4.6% |
| Median | 6.4% | 4.6% |
| Interquartile 25% (IQ1) | 4.8% | 4.2% |
| Interquartile 75% (IQ3) | 8.8% | 5.2% |
| Interquartile Range (IQR) | 4.0% | 0.99% |
| Standard Deviation (Sample) | 9.1% | 1.3% |
| Standard Deviation (Population) | 8.9% | 1.3% |
Similar Demographics by Male Unemployment
Demographics Similar to Houma by Male Unemployment
In terms of male unemployment, the demographic groups most similar to Houma are Immigrants from Guyana (7.1%, a difference of 0.030%), Guyanese (7.1%, a difference of 0.080%), Cape Verdean (7.1%, a difference of 0.15%), Immigrants from Barbados (7.1%, a difference of 0.21%), and Immigrants from Dominica (7.0%, a difference of 1.5%).
| Demographics | Rating | Rank | Male Unemployment |
| Aleuts | 0.0 /100 | #308 | Tragic 6.8% |
| Barbadians | 0.0 /100 | #309 | Tragic 6.9% |
| Blacks/African Americans | 0.0 /100 | #310 | Tragic 6.9% |
| Immigrants | Armenia | 0.0 /100 | #311 | Tragic 6.9% |
| Lumbee | 0.0 /100 | #312 | Tragic 6.9% |
| Immigrants | Dominica | 0.0 /100 | #313 | Tragic 7.0% |
| Immigrants | Barbados | 0.0 /100 | #314 | Tragic 7.1% |
| Houma | 0.0 /100 | #315 | Tragic 7.1% |
| Immigrants | Guyana | 0.0 /100 | #316 | Tragic 7.1% |
| Guyanese | 0.0 /100 | #317 | Tragic 7.1% |
| Cape Verdeans | 0.0 /100 | #318 | Tragic 7.1% |
| British West Indians | 0.0 /100 | #319 | Tragic 7.3% |
| Colville | 0.0 /100 | #320 | Tragic 7.4% |
| Immigrants | St. Vincent and the Grenadines | 0.0 /100 | #321 | Tragic 7.5% |
| Immigrants | Cabo Verde | 0.0 /100 | #322 | Tragic 7.5% |
Demographics Similar to Immigrants from Bosnia and Herzegovina by Male Unemployment
In terms of male unemployment, the demographic groups most similar to Immigrants from Bosnia and Herzegovina are Scotch-Irish (4.9%, a difference of 0.020%), Burmese (4.9%, a difference of 0.070%), Northern European (4.9%, a difference of 0.15%), Immigrants from Singapore (4.9%, a difference of 0.23%), and Chinese (4.9%, a difference of 0.24%).
| Demographics | Rating | Rank | Male Unemployment |
| Sudanese | 99.8 /100 | #31 | Exceptional 4.8% |
| Immigrants | Nepal | 99.8 /100 | #32 | Exceptional 4.8% |
| Latvians | 99.7 /100 | #33 | Exceptional 4.8% |
| Welsh | 99.7 /100 | #34 | Exceptional 4.8% |
| Paraguayans | 99.5 /100 | #35 | Exceptional 4.9% |
| Immigrants | Singapore | 99.4 /100 | #36 | Exceptional 4.9% |
| Scotch-Irish | 99.4 /100 | #37 | Exceptional 4.9% |
| Immigrants | Bosnia and Herzegovina | 99.4 /100 | #38 | Exceptional 4.9% |
| Burmese | 99.3 /100 | #39 | Exceptional 4.9% |
| Northern Europeans | 99.3 /100 | #40 | Exceptional 4.9% |
| Chinese | 99.3 /100 | #41 | Exceptional 4.9% |
| Immigrants | Belgium | 99.2 /100 | #42 | Exceptional 4.9% |
| Immigrants | Japan | 99.2 /100 | #43 | Exceptional 4.9% |
| Immigrants | Korea | 99.1 /100 | #44 | Exceptional 4.9% |
| Immigrants | Zimbabwe | 99.0 /100 | #45 | Exceptional 4.9% |