Pima vs Immigrants from Portugal Male Unemployment
COMPARE
Pima
Immigrants from Portugal
Male Unemployment
Male Unemployment Comparison
Pima
Immigrants from Portugal
8.3%
MALE UNEMPLOYMENT
0.0/ 100
METRIC RATING
332nd/ 347
METRIC RANK
5.9%
MALE UNEMPLOYMENT
0.1/ 100
METRIC RATING
262nd/ 347
METRIC RANK
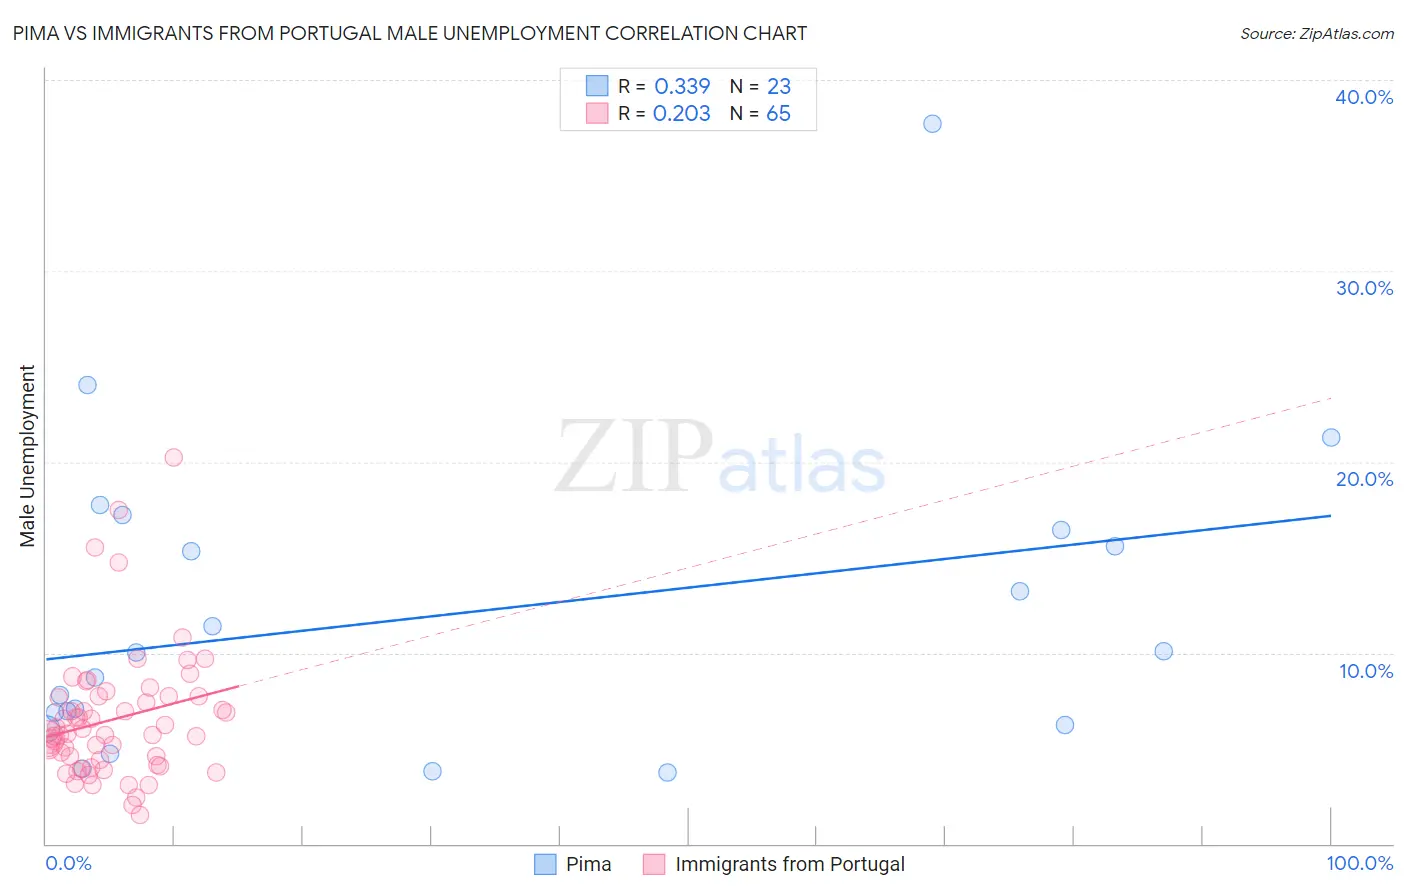
Pima vs Immigrants from Portugal Male Unemployment Correlation Chart
The statistical analysis conducted on geographies consisting of 61,468,646 people shows a mild positive correlation between the proportion of Pima and unemployment rate among males in the United States with a correlation coefficient (R) of 0.339 and weighted average of 8.3%. Similarly, the statistical analysis conducted on geographies consisting of 174,523,073 people shows a weak positive correlation between the proportion of Immigrants from Portugal and unemployment rate among males in the United States with a correlation coefficient (R) of 0.203 and weighted average of 5.9%, a difference of 41.2%.
Male Unemployment Correlation Summary
| Measurement | Pima | Immigrants from Portugal |
| Minimum | 3.7% | 1.5% |
| Maximum | 37.7% | 20.2% |
| Range | 34.0% | 18.7% |
| Mean | 12.0% | 6.5% |
| Median | 10.0% | 5.7% |
| Interquartile 25% (IQ1) | 6.2% | 4.2% |
| Interquartile 75% (IQ3) | 16.4% | 7.7% |
| Interquartile Range (IQR) | 10.2% | 3.4% |
| Standard Deviation (Sample) | 8.1% | 3.4% |
| Standard Deviation (Population) | 7.9% | 3.4% |
Similar Demographics by Male Unemployment
Demographics Similar to Pima by Male Unemployment
In terms of male unemployment, the demographic groups most similar to Pima are Sioux (8.4%, a difference of 1.3%), Tsimshian (8.5%, a difference of 2.3%), Alaska Native (8.1%, a difference of 2.4%), Pueblo (8.5%, a difference of 2.4%), and Yuman (8.6%, a difference of 3.8%).
| Demographics | Rating | Rank | Male Unemployment |
| Shoshone | 0.0 /100 | #325 | Tragic 7.6% |
| Immigrants | Dominican Republic | 0.0 /100 | #326 | Tragic 7.6% |
| Paiute | 0.0 /100 | #327 | Tragic 7.7% |
| Natives/Alaskans | 0.0 /100 | #328 | Tragic 7.7% |
| Immigrants | Yemen | 0.0 /100 | #329 | Tragic 7.8% |
| Yakama | 0.0 /100 | #330 | Tragic 7.9% |
| Alaska Natives | 0.0 /100 | #331 | Tragic 8.1% |
| Pima | 0.0 /100 | #332 | Tragic 8.3% |
| Sioux | 0.0 /100 | #333 | Tragic 8.4% |
| Tsimshian | 0.0 /100 | #334 | Tragic 8.5% |
| Pueblo | 0.0 /100 | #335 | Tragic 8.5% |
| Yuman | 0.0 /100 | #336 | Tragic 8.6% |
| Puerto Ricans | 0.0 /100 | #337 | Tragic 8.6% |
| Apache | 0.0 /100 | #338 | Tragic 8.6% |
| Cheyenne | 0.0 /100 | #339 | Tragic 9.8% |
Demographics Similar to Immigrants from Portugal by Male Unemployment
In terms of male unemployment, the demographic groups most similar to Immigrants from Portugal are Immigrants from Latin America (5.9%, a difference of 0.24%), Liberian (5.8%, a difference of 0.45%), Immigrants from Mexico (5.9%, a difference of 0.46%), Immigrants from Central America (5.8%, a difference of 0.63%), and Cajun (5.8%, a difference of 0.69%).
| Demographics | Rating | Rank | Male Unemployment |
| Kiowa | 0.2 /100 | #255 | Tragic 5.8% |
| Comanche | 0.2 /100 | #256 | Tragic 5.8% |
| Hispanics or Latinos | 0.1 /100 | #257 | Tragic 5.8% |
| Dutch West Indians | 0.1 /100 | #258 | Tragic 5.8% |
| Cajuns | 0.1 /100 | #259 | Tragic 5.8% |
| Immigrants | Central America | 0.1 /100 | #260 | Tragic 5.8% |
| Liberians | 0.1 /100 | #261 | Tragic 5.8% |
| Immigrants | Portugal | 0.1 /100 | #262 | Tragic 5.9% |
| Immigrants | Latin America | 0.1 /100 | #263 | Tragic 5.9% |
| Immigrants | Mexico | 0.0 /100 | #264 | Tragic 5.9% |
| French American Indians | 0.0 /100 | #265 | Tragic 5.9% |
| Bahamians | 0.0 /100 | #266 | Tragic 5.9% |
| Nigerians | 0.0 /100 | #267 | Tragic 5.9% |
| Bermudans | 0.0 /100 | #268 | Tragic 5.9% |
| Immigrants | Nigeria | 0.0 /100 | #269 | Tragic 6.0% |