Houma vs Immigrants from Caribbean Male Unemployment
COMPARE
Houma
Immigrants from Caribbean
Male Unemployment
Male Unemployment Comparison
Houma
Immigrants from Caribbean
7.1%
MALE UNEMPLOYMENT
0.0/ 100
METRIC RATING
315th/ 347
METRIC RANK
6.3%
MALE UNEMPLOYMENT
0.0/ 100
METRIC RATING
289th/ 347
METRIC RANK
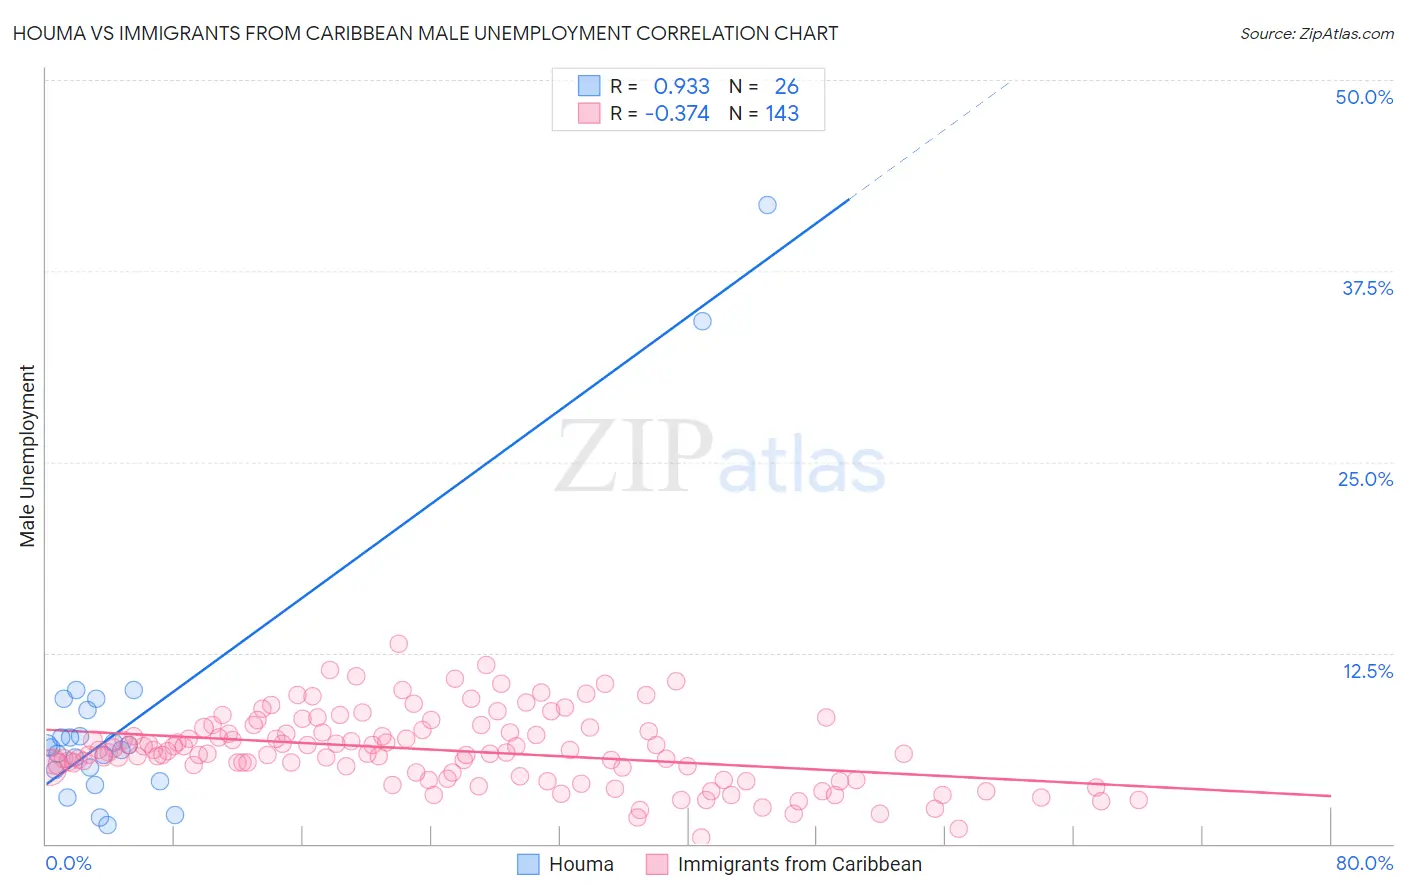
Houma vs Immigrants from Caribbean Male Unemployment Correlation Chart
The statistical analysis conducted on geographies consisting of 36,684,970 people shows a near-perfect positive correlation between the proportion of Houma and unemployment rate among males in the United States with a correlation coefficient (R) of 0.933 and weighted average of 7.1%. Similarly, the statistical analysis conducted on geographies consisting of 447,554,684 people shows a mild negative correlation between the proportion of Immigrants from Caribbean and unemployment rate among males in the United States with a correlation coefficient (R) of -0.374 and weighted average of 6.3%, a difference of 13.2%.
Male Unemployment Correlation Summary
| Measurement | Houma | Immigrants from Caribbean |
| Minimum | 1.2% | 0.40% |
| Maximum | 41.8% | 13.1% |
| Range | 40.6% | 12.7% |
| Mean | 8.4% | 6.1% |
| Median | 6.4% | 6.0% |
| Interquartile 25% (IQ1) | 4.8% | 4.6% |
| Interquartile 75% (IQ3) | 8.8% | 7.5% |
| Interquartile Range (IQR) | 4.0% | 2.8% |
| Standard Deviation (Sample) | 9.1% | 2.4% |
| Standard Deviation (Population) | 8.9% | 2.3% |
Similar Demographics by Male Unemployment
Demographics Similar to Houma by Male Unemployment
In terms of male unemployment, the demographic groups most similar to Houma are Immigrants from Guyana (7.1%, a difference of 0.030%), Guyanese (7.1%, a difference of 0.080%), Cape Verdean (7.1%, a difference of 0.15%), Immigrants from Barbados (7.1%, a difference of 0.21%), and Immigrants from Dominica (7.0%, a difference of 1.5%).
| Demographics | Rating | Rank | Male Unemployment |
| Aleuts | 0.0 /100 | #308 | Tragic 6.8% |
| Barbadians | 0.0 /100 | #309 | Tragic 6.9% |
| Blacks/African Americans | 0.0 /100 | #310 | Tragic 6.9% |
| Immigrants | Armenia | 0.0 /100 | #311 | Tragic 6.9% |
| Lumbee | 0.0 /100 | #312 | Tragic 6.9% |
| Immigrants | Dominica | 0.0 /100 | #313 | Tragic 7.0% |
| Immigrants | Barbados | 0.0 /100 | #314 | Tragic 7.1% |
| Houma | 0.0 /100 | #315 | Tragic 7.1% |
| Immigrants | Guyana | 0.0 /100 | #316 | Tragic 7.1% |
| Guyanese | 0.0 /100 | #317 | Tragic 7.1% |
| Cape Verdeans | 0.0 /100 | #318 | Tragic 7.1% |
| British West Indians | 0.0 /100 | #319 | Tragic 7.3% |
| Colville | 0.0 /100 | #320 | Tragic 7.4% |
| Immigrants | St. Vincent and the Grenadines | 0.0 /100 | #321 | Tragic 7.5% |
| Immigrants | Cabo Verde | 0.0 /100 | #322 | Tragic 7.5% |
Demographics Similar to Immigrants from Caribbean by Male Unemployment
In terms of male unemployment, the demographic groups most similar to Immigrants from Caribbean are Immigrants from Senegal (6.3%, a difference of 0.12%), Central American Indian (6.3%, a difference of 0.16%), African (6.3%, a difference of 0.45%), Immigrants from Ecuador (6.2%, a difference of 0.88%), and Spanish American Indian (6.2%, a difference of 0.90%).
| Demographics | Rating | Rank | Male Unemployment |
| Ecuadorians | 0.0 /100 | #282 | Tragic 6.2% |
| Immigrants | Western Africa | 0.0 /100 | #283 | Tragic 6.2% |
| Spanish American Indians | 0.0 /100 | #284 | Tragic 6.2% |
| Immigrants | Ecuador | 0.0 /100 | #285 | Tragic 6.2% |
| Africans | 0.0 /100 | #286 | Tragic 6.3% |
| Central American Indians | 0.0 /100 | #287 | Tragic 6.3% |
| Immigrants | Senegal | 0.0 /100 | #288 | Tragic 6.3% |
| Immigrants | Caribbean | 0.0 /100 | #289 | Tragic 6.3% |
| U.S. Virgin Islanders | 0.0 /100 | #290 | Tragic 6.4% |
| Immigrants | Azores | 0.0 /100 | #291 | Tragic 6.4% |
| Nepalese | 0.0 /100 | #292 | Tragic 6.4% |
| Haitians | 0.0 /100 | #293 | Tragic 6.4% |
| Senegalese | 0.0 /100 | #294 | Tragic 6.4% |
| Belizeans | 0.0 /100 | #295 | Tragic 6.5% |
| Immigrants | Haiti | 0.0 /100 | #296 | Tragic 6.5% |