Sri Lankan vs Immigrants from Portugal Male Unemployment
COMPARE
Sri Lankan
Immigrants from Portugal
Male Unemployment
Male Unemployment Comparison
Sri Lankans
Immigrants from Portugal
5.2%
MALE UNEMPLOYMENT
77.9/ 100
METRIC RATING
144th/ 347
METRIC RANK
5.9%
MALE UNEMPLOYMENT
0.1/ 100
METRIC RATING
262nd/ 347
METRIC RANK
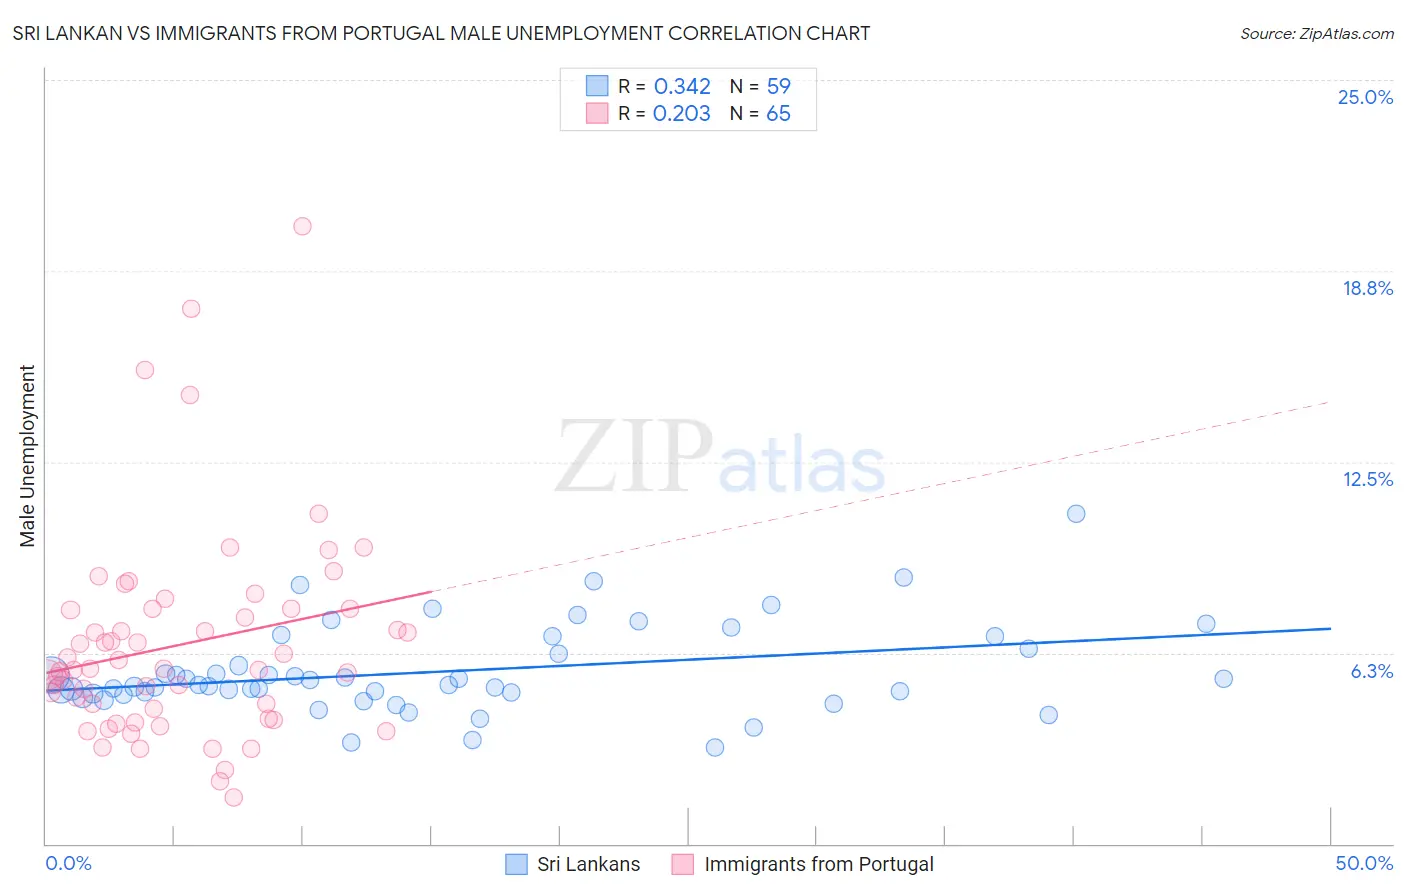
Sri Lankan vs Immigrants from Portugal Male Unemployment Correlation Chart
The statistical analysis conducted on geographies consisting of 438,393,028 people shows a mild positive correlation between the proportion of Sri Lankans and unemployment rate among males in the United States with a correlation coefficient (R) of 0.342 and weighted average of 5.2%. Similarly, the statistical analysis conducted on geographies consisting of 174,523,073 people shows a weak positive correlation between the proportion of Immigrants from Portugal and unemployment rate among males in the United States with a correlation coefficient (R) of 0.203 and weighted average of 5.9%, a difference of 12.7%.
Male Unemployment Correlation Summary
| Measurement | Sri Lankan | Immigrants from Portugal |
| Minimum | 3.1% | 1.5% |
| Maximum | 10.8% | 20.2% |
| Range | 7.7% | 18.7% |
| Mean | 5.6% | 6.5% |
| Median | 5.2% | 5.7% |
| Interquartile 25% (IQ1) | 4.9% | 4.2% |
| Interquartile 75% (IQ3) | 6.4% | 7.7% |
| Interquartile Range (IQR) | 1.5% | 3.4% |
| Standard Deviation (Sample) | 1.4% | 3.4% |
| Standard Deviation (Population) | 1.4% | 3.4% |
Similar Demographics by Male Unemployment
Demographics Similar to Sri Lankans by Male Unemployment
In terms of male unemployment, the demographic groups most similar to Sri Lankans are Syrian (5.2%, a difference of 0.010%), Macedonian (5.2%, a difference of 0.010%), Immigrants from Kenya (5.2%, a difference of 0.020%), Fijian (5.2%, a difference of 0.030%), and Immigrants from Burma/Myanmar (5.2%, a difference of 0.030%).
| Demographics | Rating | Rank | Male Unemployment |
| Immigrants | Eastern Africa | 79.8 /100 | #137 | Good 5.2% |
| Immigrants | Croatia | 79.7 /100 | #138 | Good 5.2% |
| Kenyans | 79.4 /100 | #139 | Good 5.2% |
| Brazilians | 79.3 /100 | #140 | Good 5.2% |
| Immigrants | Switzerland | 79.2 /100 | #141 | Good 5.2% |
| Fijians | 78.3 /100 | #142 | Good 5.2% |
| Syrians | 78.0 /100 | #143 | Good 5.2% |
| Sri Lankans | 77.9 /100 | #144 | Good 5.2% |
| Macedonians | 77.7 /100 | #145 | Good 5.2% |
| Immigrants | Kenya | 77.6 /100 | #146 | Good 5.2% |
| Immigrants | Burma/Myanmar | 77.5 /100 | #147 | Good 5.2% |
| Immigrants | Italy | 76.3 /100 | #148 | Good 5.2% |
| Immigrants | Europe | 76.2 /100 | #149 | Good 5.2% |
| Indians (Asian) | 76.0 /100 | #150 | Good 5.2% |
| Slovaks | 75.5 /100 | #151 | Good 5.2% |
Demographics Similar to Immigrants from Portugal by Male Unemployment
In terms of male unemployment, the demographic groups most similar to Immigrants from Portugal are Immigrants from Latin America (5.9%, a difference of 0.24%), Liberian (5.8%, a difference of 0.45%), Immigrants from Mexico (5.9%, a difference of 0.46%), Immigrants from Central America (5.8%, a difference of 0.63%), and Cajun (5.8%, a difference of 0.69%).
| Demographics | Rating | Rank | Male Unemployment |
| Kiowa | 0.2 /100 | #255 | Tragic 5.8% |
| Comanche | 0.2 /100 | #256 | Tragic 5.8% |
| Hispanics or Latinos | 0.1 /100 | #257 | Tragic 5.8% |
| Dutch West Indians | 0.1 /100 | #258 | Tragic 5.8% |
| Cajuns | 0.1 /100 | #259 | Tragic 5.8% |
| Immigrants | Central America | 0.1 /100 | #260 | Tragic 5.8% |
| Liberians | 0.1 /100 | #261 | Tragic 5.8% |
| Immigrants | Portugal | 0.1 /100 | #262 | Tragic 5.9% |
| Immigrants | Latin America | 0.1 /100 | #263 | Tragic 5.9% |
| Immigrants | Mexico | 0.0 /100 | #264 | Tragic 5.9% |
| French American Indians | 0.0 /100 | #265 | Tragic 5.9% |
| Bahamians | 0.0 /100 | #266 | Tragic 5.9% |
| Nigerians | 0.0 /100 | #267 | Tragic 5.9% |
| Bermudans | 0.0 /100 | #268 | Tragic 5.9% |
| Immigrants | Nigeria | 0.0 /100 | #269 | Tragic 6.0% |