Houma vs Immigrants from Portugal 1st Grade
COMPARE
Houma
Immigrants from Portugal
1st Grade
1st Grade Comparison
Houma
Immigrants from Portugal
97.2%
1ST GRADE
0.0/ 100
METRIC RATING
291st/ 347
METRIC RANK
97.3%
1ST GRADE
0.0/ 100
METRIC RATING
285th/ 347
METRIC RANK
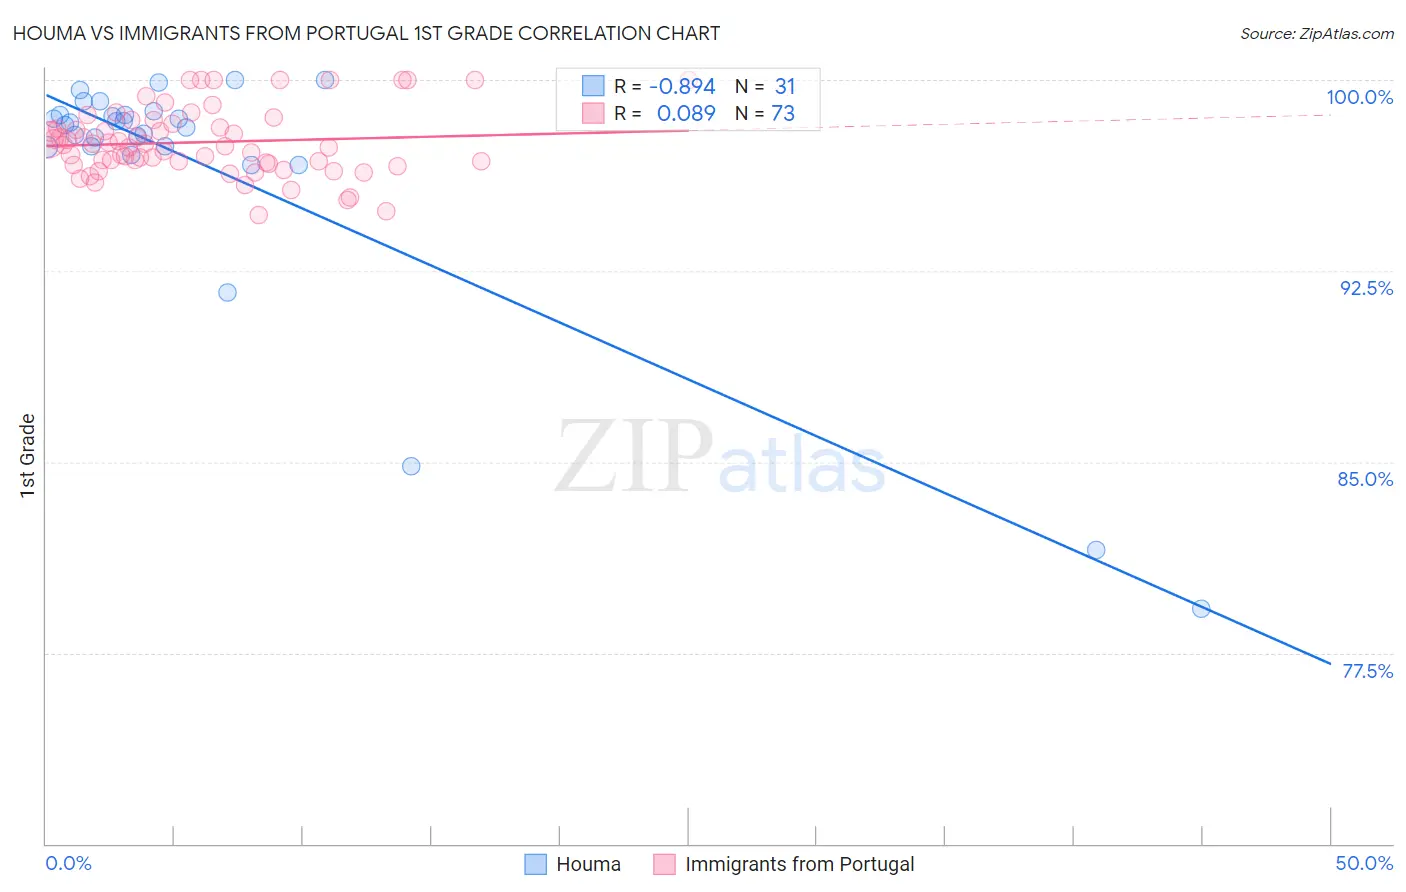
Houma vs Immigrants from Portugal 1st Grade Correlation Chart
The statistical analysis conducted on geographies consisting of 36,795,916 people shows a very strong negative correlation between the proportion of Houma and percentage of population with at least 1st grade education in the United States with a correlation coefficient (R) of -0.894 and weighted average of 97.2%. Similarly, the statistical analysis conducted on geographies consisting of 174,792,107 people shows a slight positive correlation between the proportion of Immigrants from Portugal and percentage of population with at least 1st grade education in the United States with a correlation coefficient (R) of 0.089 and weighted average of 97.3%, a difference of 0.070%.
1st Grade Correlation Summary
| Measurement | Houma | Immigrants from Portugal |
| Minimum | 79.2% | 94.7% |
| Maximum | 100.0% | 100.0% |
| Range | 20.8% | 5.3% |
| Mean | 96.5% | 97.6% |
| Median | 98.2% | 97.4% |
| Interquartile 25% (IQ1) | 97.4% | 96.7% |
| Interquartile 75% (IQ3) | 98.6% | 98.3% |
| Interquartile Range (IQR) | 1.2% | 1.6% |
| Standard Deviation (Sample) | 5.1% | 1.3% |
| Standard Deviation (Population) | 5.1% | 1.3% |
Demographics Similar to Houma and Immigrants from Portugal by 1st Grade
In terms of 1st grade, the demographic groups most similar to Houma are Immigrants from Afghanistan (97.3%, a difference of 0.020%), Immigrants from St. Vincent and the Grenadines (97.3%, a difference of 0.020%), British West Indian (97.2%, a difference of 0.020%), Immigrants from Hong Kong (97.3%, a difference of 0.040%), and Immigrants from Thailand (97.3%, a difference of 0.040%). Similarly, the demographic groups most similar to Immigrants from Portugal are Immigrants from Trinidad and Tobago (97.3%, a difference of 0.0%), Immigrants from West Indies (97.3%, a difference of 0.010%), Immigrants from Barbados (97.3%, a difference of 0.010%), Immigrants from Hong Kong (97.3%, a difference of 0.030%), and Immigrants from Thailand (97.3%, a difference of 0.030%).
| Demographics | Rating | Rank | 1st Grade |
| Immigrants | Uzbekistan | 0.1 /100 | #278 | Tragic 97.4% |
| Immigrants | Ghana | 0.1 /100 | #279 | Tragic 97.4% |
| Afghans | 0.1 /100 | #280 | Tragic 97.4% |
| Trinidadians and Tobagonians | 0.1 /100 | #281 | Tragic 97.3% |
| Barbadians | 0.1 /100 | #282 | Tragic 97.3% |
| Immigrants | West Indies | 0.0 /100 | #283 | Tragic 97.3% |
| Immigrants | Trinidad and Tobago | 0.0 /100 | #284 | Tragic 97.3% |
| Immigrants | Portugal | 0.0 /100 | #285 | Tragic 97.3% |
| Immigrants | Barbados | 0.0 /100 | #286 | Tragic 97.3% |
| Immigrants | Hong Kong | 0.0 /100 | #287 | Tragic 97.3% |
| Immigrants | Thailand | 0.0 /100 | #288 | Tragic 97.3% |
| Immigrants | Afghanistan | 0.0 /100 | #289 | Tragic 97.3% |
| Immigrants | St. Vincent and the Grenadines | 0.0 /100 | #290 | Tragic 97.3% |
| Houma | 0.0 /100 | #291 | Tragic 97.2% |
| British West Indians | 0.0 /100 | #292 | Tragic 97.2% |
| Malaysians | 0.0 /100 | #293 | Tragic 97.2% |
| Immigrants | Grenada | 0.0 /100 | #294 | Tragic 97.2% |
| Immigrants | Immigrants | 0.0 /100 | #295 | Tragic 97.2% |
| Immigrants | Eritrea | 0.0 /100 | #296 | Tragic 97.2% |
| Central American Indians | 0.0 /100 | #297 | Tragic 97.1% |
| Immigrants | Dominica | 0.0 /100 | #298 | Tragic 97.1% |