Houma vs Immigrants from Moldova Male Unemployment
COMPARE
Houma
Immigrants from Moldova
Male Unemployment
Male Unemployment Comparison
Houma
Immigrants from Moldova
7.1%
MALE UNEMPLOYMENT
0.0/ 100
METRIC RATING
315th/ 347
METRIC RANK
5.1%
MALE UNEMPLOYMENT
90.3/ 100
METRIC RATING
112th/ 347
METRIC RANK
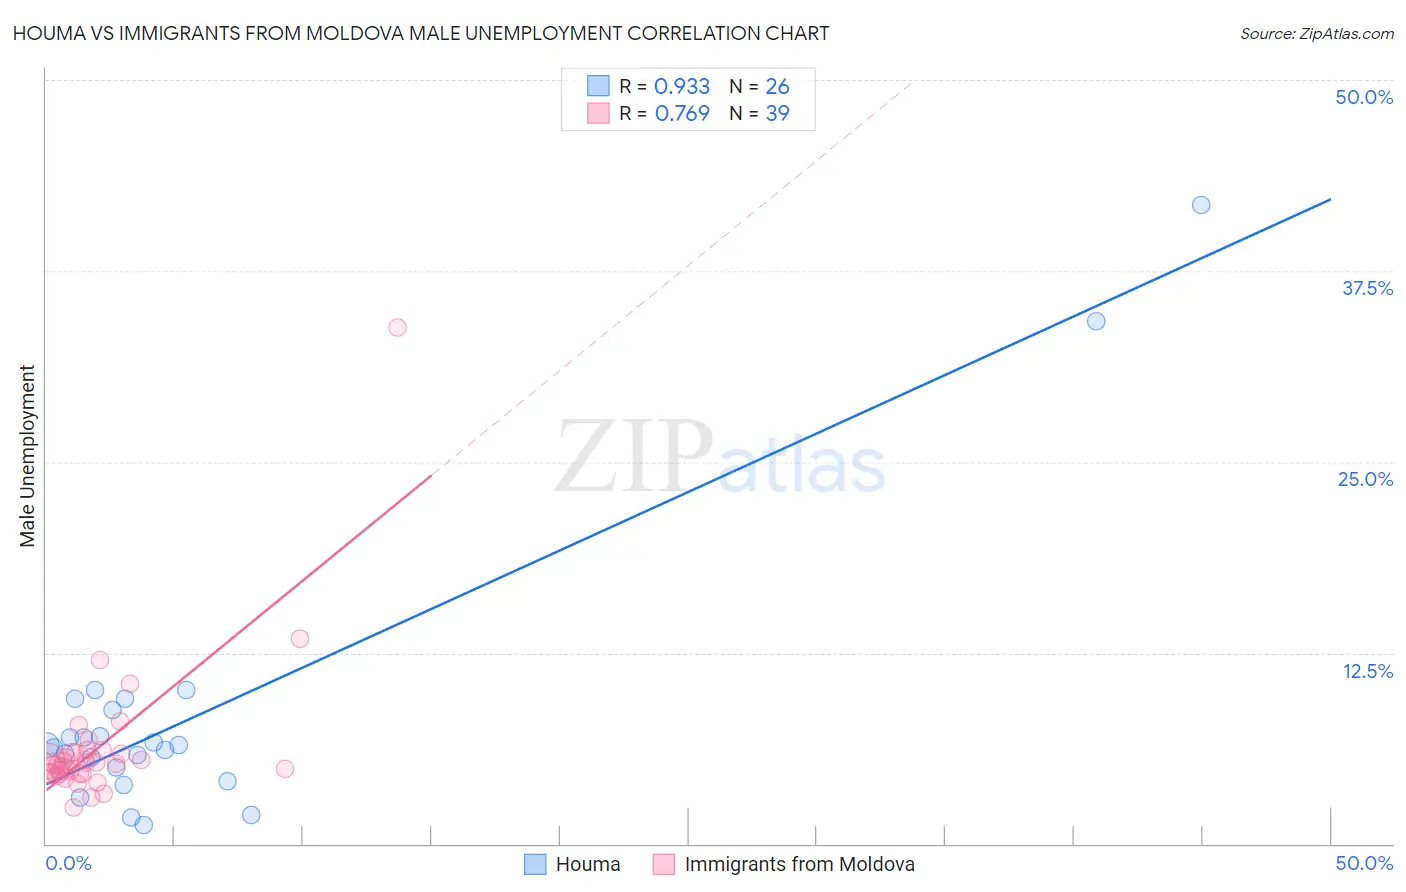
Houma vs Immigrants from Moldova Male Unemployment Correlation Chart
The statistical analysis conducted on geographies consisting of 36,684,970 people shows a near-perfect positive correlation between the proportion of Houma and unemployment rate among males in the United States with a correlation coefficient (R) of 0.933 and weighted average of 7.1%. Similarly, the statistical analysis conducted on geographies consisting of 124,231,836 people shows a strong positive correlation between the proportion of Immigrants from Moldova and unemployment rate among males in the United States with a correlation coefficient (R) of 0.769 and weighted average of 5.1%, a difference of 38.8%.
Male Unemployment Correlation Summary
| Measurement | Houma | Immigrants from Moldova |
| Minimum | 1.2% | 2.4% |
| Maximum | 41.8% | 33.8% |
| Range | 40.6% | 31.4% |
| Mean | 8.4% | 6.4% |
| Median | 6.4% | 5.3% |
| Interquartile 25% (IQ1) | 4.8% | 4.6% |
| Interquartile 75% (IQ3) | 8.8% | 6.0% |
| Interquartile Range (IQR) | 4.0% | 1.4% |
| Standard Deviation (Sample) | 9.1% | 5.0% |
| Standard Deviation (Population) | 8.9% | 4.9% |
Similar Demographics by Male Unemployment
Demographics Similar to Houma by Male Unemployment
In terms of male unemployment, the demographic groups most similar to Houma are Immigrants from Guyana (7.1%, a difference of 0.030%), Guyanese (7.1%, a difference of 0.080%), Cape Verdean (7.1%, a difference of 0.15%), Immigrants from Barbados (7.1%, a difference of 0.21%), and Immigrants from Dominica (7.0%, a difference of 1.5%).
| Demographics | Rating | Rank | Male Unemployment |
| Aleuts | 0.0 /100 | #308 | Tragic 6.8% |
| Barbadians | 0.0 /100 | #309 | Tragic 6.9% |
| Blacks/African Americans | 0.0 /100 | #310 | Tragic 6.9% |
| Immigrants | Armenia | 0.0 /100 | #311 | Tragic 6.9% |
| Lumbee | 0.0 /100 | #312 | Tragic 6.9% |
| Immigrants | Dominica | 0.0 /100 | #313 | Tragic 7.0% |
| Immigrants | Barbados | 0.0 /100 | #314 | Tragic 7.1% |
| Houma | 0.0 /100 | #315 | Tragic 7.1% |
| Immigrants | Guyana | 0.0 /100 | #316 | Tragic 7.1% |
| Guyanese | 0.0 /100 | #317 | Tragic 7.1% |
| Cape Verdeans | 0.0 /100 | #318 | Tragic 7.1% |
| British West Indians | 0.0 /100 | #319 | Tragic 7.3% |
| Colville | 0.0 /100 | #320 | Tragic 7.4% |
| Immigrants | St. Vincent and the Grenadines | 0.0 /100 | #321 | Tragic 7.5% |
| Immigrants | Cabo Verde | 0.0 /100 | #322 | Tragic 7.5% |
Demographics Similar to Immigrants from Moldova by Male Unemployment
In terms of male unemployment, the demographic groups most similar to Immigrants from Moldova are Immigrants from Austria (5.1%, a difference of 0.010%), Immigrants from Eastern Asia (5.1%, a difference of 0.080%), Romanian (5.1%, a difference of 0.080%), Immigrants from England (5.1%, a difference of 0.090%), and Immigrants from Pakistan (5.1%, a difference of 0.11%).
| Demographics | Rating | Rank | Male Unemployment |
| Immigrants | Czechoslovakia | 91.7 /100 | #105 | Exceptional 5.1% |
| Immigrants | Ethiopia | 91.5 /100 | #106 | Exceptional 5.1% |
| Ethiopians | 91.3 /100 | #107 | Exceptional 5.1% |
| Immigrants | Nicaragua | 91.2 /100 | #108 | Exceptional 5.1% |
| Immigrants | Pakistan | 90.9 /100 | #109 | Exceptional 5.1% |
| Immigrants | England | 90.8 /100 | #110 | Exceptional 5.1% |
| Immigrants | Eastern Asia | 90.8 /100 | #111 | Exceptional 5.1% |
| Immigrants | Moldova | 90.3 /100 | #112 | Exceptional 5.1% |
| Immigrants | Austria | 90.3 /100 | #113 | Exceptional 5.1% |
| Romanians | 89.8 /100 | #114 | Excellent 5.1% |
| Immigrants | Asia | 89.6 /100 | #115 | Excellent 5.1% |
| Immigrants | Denmark | 89.4 /100 | #116 | Excellent 5.1% |
| Estonians | 89.0 /100 | #117 | Excellent 5.1% |
| Cypriots | 88.8 /100 | #118 | Excellent 5.1% |
| French Canadians | 88.6 /100 | #119 | Excellent 5.1% |