Israeli vs Navajo Male Unemployment
COMPARE
Israeli
Navajo
Male Unemployment
Male Unemployment Comparison
Israelis
Navajo
5.5%
MALE UNEMPLOYMENT
7.4/ 100
METRIC RATING
211th/ 347
METRIC RANK
9.8%
MALE UNEMPLOYMENT
0.0/ 100
METRIC RATING
341st/ 347
METRIC RANK
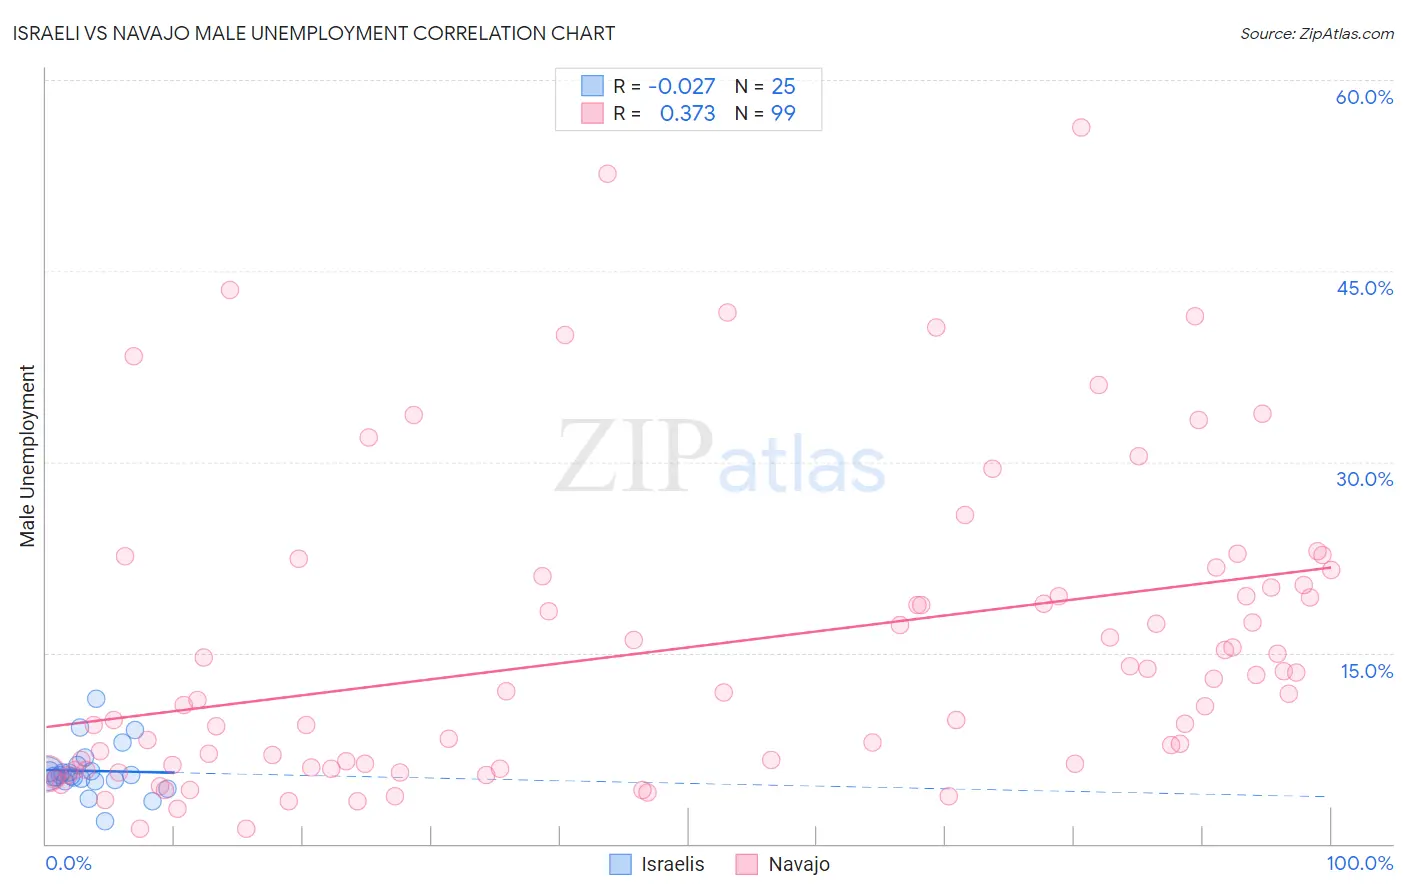
Israeli vs Navajo Male Unemployment Correlation Chart
The statistical analysis conducted on geographies consisting of 210,829,050 people shows no correlation between the proportion of Israelis and unemployment rate among males in the United States with a correlation coefficient (R) of -0.027 and weighted average of 5.5%. Similarly, the statistical analysis conducted on geographies consisting of 223,979,709 people shows a mild positive correlation between the proportion of Navajo and unemployment rate among males in the United States with a correlation coefficient (R) of 0.373 and weighted average of 9.8%, a difference of 79.1%.
Male Unemployment Correlation Summary
| Measurement | Israeli | Navajo |
| Minimum | 1.8% | 1.2% |
| Maximum | 11.3% | 56.3% |
| Range | 9.5% | 55.1% |
| Mean | 5.7% | 15.4% |
| Median | 5.4% | 11.9% |
| Interquartile 25% (IQ1) | 5.0% | 6.0% |
| Interquartile 75% (IQ3) | 6.0% | 20.4% |
| Interquartile Range (IQR) | 0.98% | 14.4% |
| Standard Deviation (Sample) | 1.9% | 12.0% |
| Standard Deviation (Population) | 1.9% | 11.9% |
Similar Demographics by Male Unemployment
Demographics Similar to Israelis by Male Unemployment
In terms of male unemployment, the demographic groups most similar to Israelis are South American Indian (5.5%, a difference of 0.040%), Hmong (5.5%, a difference of 0.090%), Immigrants from Middle Africa (5.5%, a difference of 0.17%), Immigrants from Lebanon (5.5%, a difference of 0.22%), and Ugandan (5.5%, a difference of 0.25%).
| Demographics | Rating | Rank | Male Unemployment |
| Guamanians/Chamorros | 12.3 /100 | #204 | Poor 5.4% |
| Immigrants | Costa Rica | 11.4 /100 | #205 | Poor 5.5% |
| Immigrants | Ukraine | 9.9 /100 | #206 | Tragic 5.5% |
| Immigrants | Syria | 9.3 /100 | #207 | Tragic 5.5% |
| Immigrants | Lebanon | 8.6 /100 | #208 | Tragic 5.5% |
| Immigrants | Middle Africa | 8.3 /100 | #209 | Tragic 5.5% |
| South American Indians | 7.6 /100 | #210 | Tragic 5.5% |
| Israelis | 7.4 /100 | #211 | Tragic 5.5% |
| Hmong | 7.0 /100 | #212 | Tragic 5.5% |
| Ugandans | 6.3 /100 | #213 | Tragic 5.5% |
| Puget Sound Salish | 5.6 /100 | #214 | Tragic 5.5% |
| Samoans | 4.9 /100 | #215 | Tragic 5.5% |
| Immigrants | Immigrants | 4.3 /100 | #216 | Tragic 5.5% |
| Delaware | 4.2 /100 | #217 | Tragic 5.5% |
| Immigrants | Albania | 3.6 /100 | #218 | Tragic 5.5% |
Demographics Similar to Navajo by Male Unemployment
In terms of male unemployment, the demographic groups most similar to Navajo are Alaskan Athabascan (9.8%, a difference of 0.28%), Cheyenne (9.8%, a difference of 0.36%), Tohono O'odham (10.2%, a difference of 3.4%), Crow (10.6%, a difference of 7.9%), and Hopi (10.8%, a difference of 9.7%).
| Demographics | Rating | Rank | Male Unemployment |
| Sioux | 0.0 /100 | #333 | Tragic 8.4% |
| Tsimshian | 0.0 /100 | #334 | Tragic 8.5% |
| Pueblo | 0.0 /100 | #335 | Tragic 8.5% |
| Yuman | 0.0 /100 | #336 | Tragic 8.6% |
| Puerto Ricans | 0.0 /100 | #337 | Tragic 8.6% |
| Apache | 0.0 /100 | #338 | Tragic 8.6% |
| Cheyenne | 0.0 /100 | #339 | Tragic 9.8% |
| Alaskan Athabascans | 0.0 /100 | #340 | Tragic 9.8% |
| Navajo | 0.0 /100 | #341 | Tragic 9.8% |
| Tohono O'odham | 0.0 /100 | #342 | Tragic 10.2% |
| Crow | 0.0 /100 | #343 | Tragic 10.6% |
| Hopi | 0.0 /100 | #344 | Tragic 10.8% |
| Arapaho | 0.0 /100 | #345 | Tragic 11.0% |
| Inupiat | 0.0 /100 | #346 | Tragic 12.1% |
| Yup'ik | 0.0 /100 | #347 | Tragic 16.4% |