Delaware vs Navajo Male Unemployment
COMPARE
Delaware
Navajo
Male Unemployment
Male Unemployment Comparison
Delaware
Navajo
5.5%
MALE UNEMPLOYMENT
4.2/ 100
METRIC RATING
217th/ 347
METRIC RANK
9.8%
MALE UNEMPLOYMENT
0.0/ 100
METRIC RATING
341st/ 347
METRIC RANK
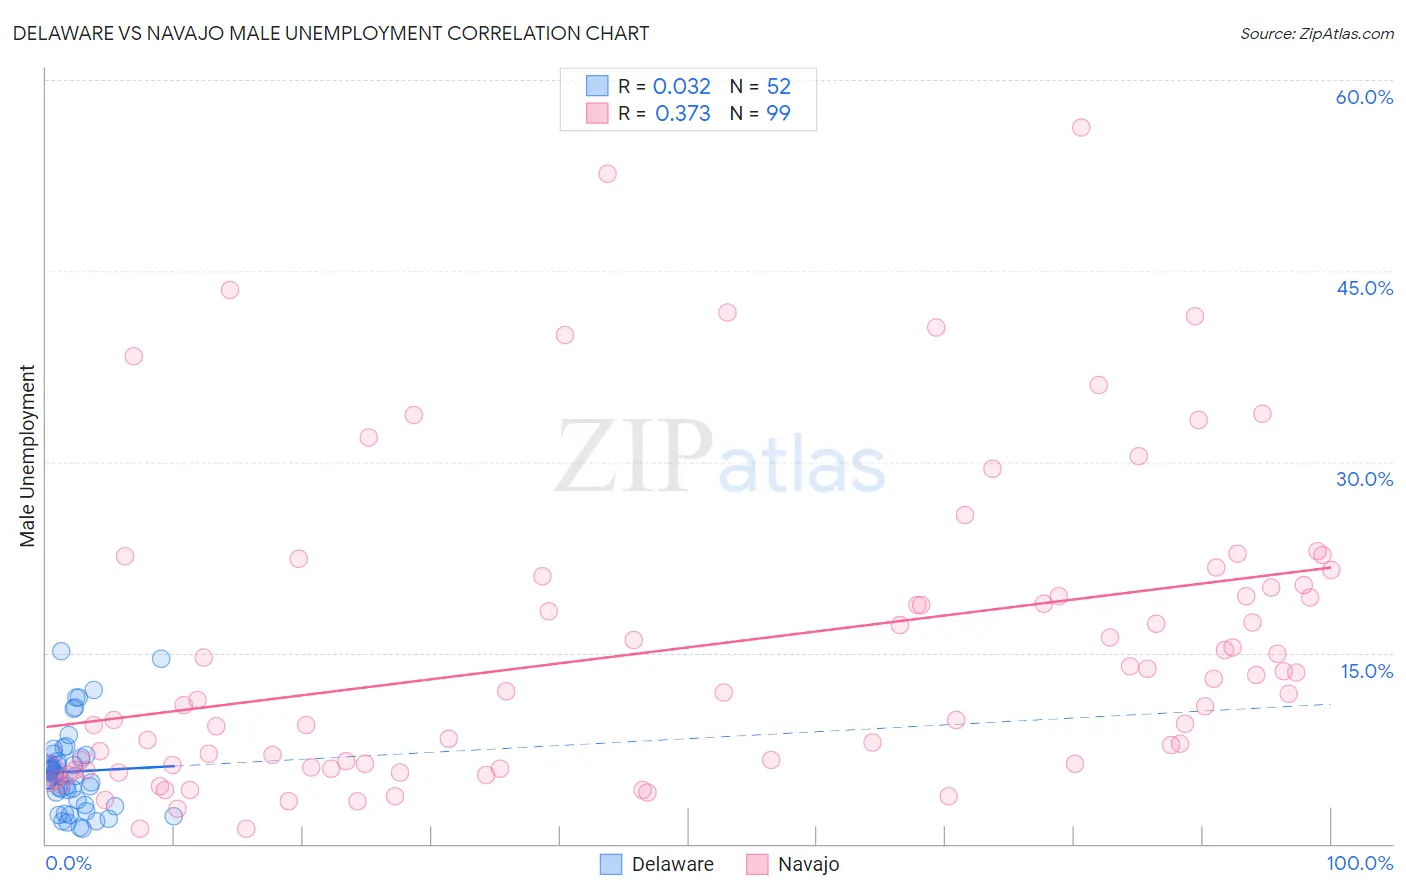
Delaware vs Navajo Male Unemployment Correlation Chart
The statistical analysis conducted on geographies consisting of 96,069,149 people shows no correlation between the proportion of Delaware and unemployment rate among males in the United States with a correlation coefficient (R) of 0.032 and weighted average of 5.5%. Similarly, the statistical analysis conducted on geographies consisting of 223,979,709 people shows a mild positive correlation between the proportion of Navajo and unemployment rate among males in the United States with a correlation coefficient (R) of 0.373 and weighted average of 9.8%, a difference of 77.6%.
Male Unemployment Correlation Summary
| Measurement | Delaware | Navajo |
| Minimum | 1.2% | 1.2% |
| Maximum | 15.1% | 56.3% |
| Range | 13.9% | 55.1% |
| Mean | 5.7% | 15.4% |
| Median | 5.3% | 11.9% |
| Interquartile 25% (IQ1) | 3.2% | 6.0% |
| Interquartile 75% (IQ3) | 6.8% | 20.4% |
| Interquartile Range (IQR) | 3.6% | 14.4% |
| Standard Deviation (Sample) | 3.3% | 12.0% |
| Standard Deviation (Population) | 3.2% | 11.9% |
Similar Demographics by Male Unemployment
Demographics Similar to Delaware by Male Unemployment
In terms of male unemployment, the demographic groups most similar to Delaware are Immigrants (5.5%, a difference of 0.050%), Immigrants from Albania (5.5%, a difference of 0.21%), Samoan (5.5%, a difference of 0.22%), Immigrants from Western Asia (5.6%, a difference of 0.25%), and Portuguese (5.6%, a difference of 0.28%).
| Demographics | Rating | Rank | Male Unemployment |
| South American Indians | 7.6 /100 | #210 | Tragic 5.5% |
| Israelis | 7.4 /100 | #211 | Tragic 5.5% |
| Hmong | 7.0 /100 | #212 | Tragic 5.5% |
| Ugandans | 6.3 /100 | #213 | Tragic 5.5% |
| Puget Sound Salish | 5.6 /100 | #214 | Tragic 5.5% |
| Samoans | 4.9 /100 | #215 | Tragic 5.5% |
| Immigrants | Immigrants | 4.3 /100 | #216 | Tragic 5.5% |
| Delaware | 4.2 /100 | #217 | Tragic 5.5% |
| Immigrants | Albania | 3.6 /100 | #218 | Tragic 5.5% |
| Immigrants | Western Asia | 3.5 /100 | #219 | Tragic 5.6% |
| Portuguese | 3.5 /100 | #220 | Tragic 5.6% |
| Soviet Union | 3.2 /100 | #221 | Tragic 5.6% |
| Immigrants | Micronesia | 2.9 /100 | #222 | Tragic 5.6% |
| Creek | 2.6 /100 | #223 | Tragic 5.6% |
| Cherokee | 2.4 /100 | #224 | Tragic 5.6% |
Demographics Similar to Navajo by Male Unemployment
In terms of male unemployment, the demographic groups most similar to Navajo are Alaskan Athabascan (9.8%, a difference of 0.28%), Cheyenne (9.8%, a difference of 0.36%), Tohono O'odham (10.2%, a difference of 3.4%), Crow (10.6%, a difference of 7.9%), and Hopi (10.8%, a difference of 9.7%).
| Demographics | Rating | Rank | Male Unemployment |
| Sioux | 0.0 /100 | #333 | Tragic 8.4% |
| Tsimshian | 0.0 /100 | #334 | Tragic 8.5% |
| Pueblo | 0.0 /100 | #335 | Tragic 8.5% |
| Yuman | 0.0 /100 | #336 | Tragic 8.6% |
| Puerto Ricans | 0.0 /100 | #337 | Tragic 8.6% |
| Apache | 0.0 /100 | #338 | Tragic 8.6% |
| Cheyenne | 0.0 /100 | #339 | Tragic 9.8% |
| Alaskan Athabascans | 0.0 /100 | #340 | Tragic 9.8% |
| Navajo | 0.0 /100 | #341 | Tragic 9.8% |
| Tohono O'odham | 0.0 /100 | #342 | Tragic 10.2% |
| Crow | 0.0 /100 | #343 | Tragic 10.6% |
| Hopi | 0.0 /100 | #344 | Tragic 10.8% |
| Arapaho | 0.0 /100 | #345 | Tragic 11.0% |
| Inupiat | 0.0 /100 | #346 | Tragic 12.1% |
| Yup'ik | 0.0 /100 | #347 | Tragic 16.4% |