Honduran vs Immigrants from Eastern Africa Male Unemployment
COMPARE
Honduran
Immigrants from Eastern Africa
Male Unemployment
Male Unemployment Comparison
Hondurans
Immigrants from Eastern Africa
5.6%
MALE UNEMPLOYMENT
1.1/ 100
METRIC RATING
237th/ 347
METRIC RANK
5.2%
MALE UNEMPLOYMENT
79.8/ 100
METRIC RATING
137th/ 347
METRIC RANK
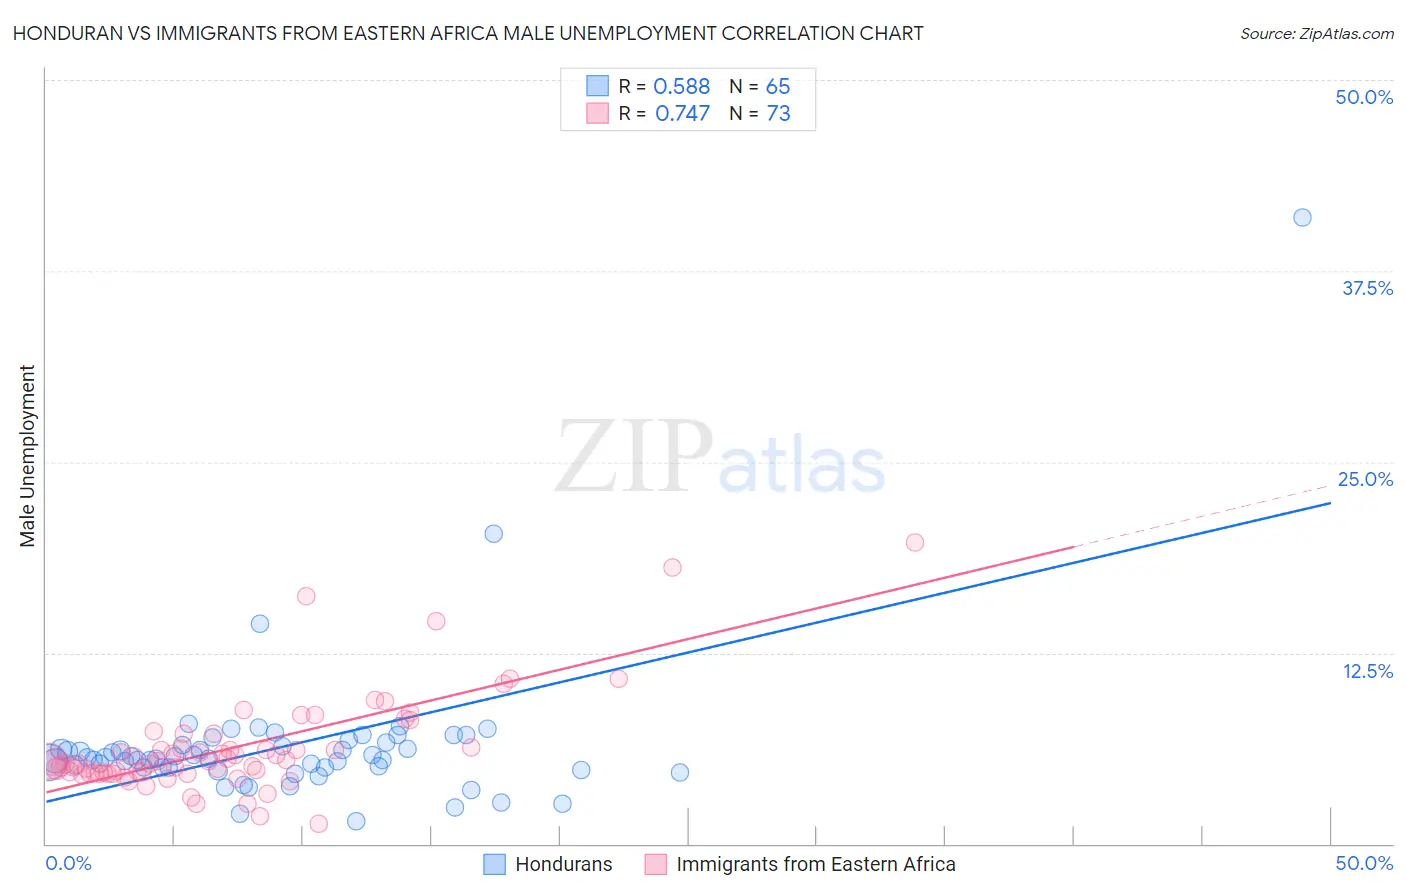
Honduran vs Immigrants from Eastern Africa Male Unemployment Correlation Chart
The statistical analysis conducted on geographies consisting of 356,702,099 people shows a substantial positive correlation between the proportion of Hondurans and unemployment rate among males in the United States with a correlation coefficient (R) of 0.588 and weighted average of 5.6%. Similarly, the statistical analysis conducted on geographies consisting of 354,168,433 people shows a strong positive correlation between the proportion of Immigrants from Eastern Africa and unemployment rate among males in the United States with a correlation coefficient (R) of 0.747 and weighted average of 5.2%, a difference of 8.7%.
Male Unemployment Correlation Summary
| Measurement | Honduran | Immigrants from Eastern Africa |
| Minimum | 1.5% | 1.3% |
| Maximum | 41.0% | 19.7% |
| Range | 39.5% | 18.4% |
| Mean | 6.4% | 6.3% |
| Median | 5.5% | 5.4% |
| Interquartile 25% (IQ1) | 5.0% | 4.6% |
| Interquartile 75% (IQ3) | 6.6% | 6.7% |
| Interquartile Range (IQR) | 1.6% | 2.1% |
| Standard Deviation (Sample) | 5.0% | 3.3% |
| Standard Deviation (Population) | 5.0% | 3.2% |
Similar Demographics by Male Unemployment
Demographics Similar to Hondurans by Male Unemployment
In terms of male unemployment, the demographic groups most similar to Hondurans are Native Hawaiian (5.6%, a difference of 0.050%), Immigrants from Guatemala (5.6%, a difference of 0.050%), Guatemalan (5.6%, a difference of 0.090%), Immigrants from Cameroon (5.6%, a difference of 0.12%), and Salvadoran (5.7%, a difference of 0.16%).
| Demographics | Rating | Rank | Male Unemployment |
| Immigrants | Africa | 1.7 /100 | #230 | Tragic 5.6% |
| Choctaw | 1.6 /100 | #231 | Tragic 5.6% |
| Moroccans | 1.6 /100 | #232 | Tragic 5.6% |
| Somalis | 1.5 /100 | #233 | Tragic 5.6% |
| Immigrants | Somalia | 1.5 /100 | #234 | Tragic 5.6% |
| Immigrants | Honduras | 1.5 /100 | #235 | Tragic 5.6% |
| Guatemalans | 1.2 /100 | #236 | Tragic 5.6% |
| Hondurans | 1.1 /100 | #237 | Tragic 5.6% |
| Native Hawaiians | 1.1 /100 | #238 | Tragic 5.6% |
| Immigrants | Guatemala | 1.1 /100 | #239 | Tragic 5.6% |
| Immigrants | Cameroon | 1.0 /100 | #240 | Tragic 5.6% |
| Salvadorans | 1.0 /100 | #241 | Tragic 5.7% |
| Ottawa | 0.9 /100 | #242 | Tragic 5.7% |
| Bangladeshis | 0.8 /100 | #243 | Tragic 5.7% |
| Immigrants | El Salvador | 0.7 /100 | #244 | Tragic 5.7% |
Demographics Similar to Immigrants from Eastern Africa by Male Unemployment
In terms of male unemployment, the demographic groups most similar to Immigrants from Eastern Africa are Lebanese (5.2%, a difference of 0.010%), Immigrants from Croatia (5.2%, a difference of 0.010%), Immigrants from Saudi Arabia (5.2%, a difference of 0.030%), Kenyan (5.2%, a difference of 0.030%), and Brazilian (5.2%, a difference of 0.040%).
| Demographics | Rating | Rank | Male Unemployment |
| Immigrants | Malaysia | 83.5 /100 | #130 | Excellent 5.2% |
| Immigrants | Germany | 83.0 /100 | #131 | Excellent 5.2% |
| Chickasaw | 82.9 /100 | #132 | Excellent 5.2% |
| Colombians | 81.1 /100 | #133 | Excellent 5.2% |
| Pakistanis | 80.5 /100 | #134 | Excellent 5.2% |
| Immigrants | Saudi Arabia | 80.1 /100 | #135 | Excellent 5.2% |
| Lebanese | 79.9 /100 | #136 | Good 5.2% |
| Immigrants | Eastern Africa | 79.8 /100 | #137 | Good 5.2% |
| Immigrants | Croatia | 79.7 /100 | #138 | Good 5.2% |
| Kenyans | 79.4 /100 | #139 | Good 5.2% |
| Brazilians | 79.3 /100 | #140 | Good 5.2% |
| Immigrants | Switzerland | 79.2 /100 | #141 | Good 5.2% |
| Fijians | 78.3 /100 | #142 | Good 5.2% |
| Syrians | 78.0 /100 | #143 | Good 5.2% |
| Sri Lankans | 77.9 /100 | #144 | Good 5.2% |