Immigrants from Ethiopia vs Navajo Male Unemployment
COMPARE
Immigrants from Ethiopia
Navajo
Male Unemployment
Male Unemployment Comparison
Immigrants from Ethiopia
Navajo
5.1%
MALE UNEMPLOYMENT
91.5/ 100
METRIC RATING
106th/ 347
METRIC RANK
9.8%
MALE UNEMPLOYMENT
0.0/ 100
METRIC RATING
341st/ 347
METRIC RANK
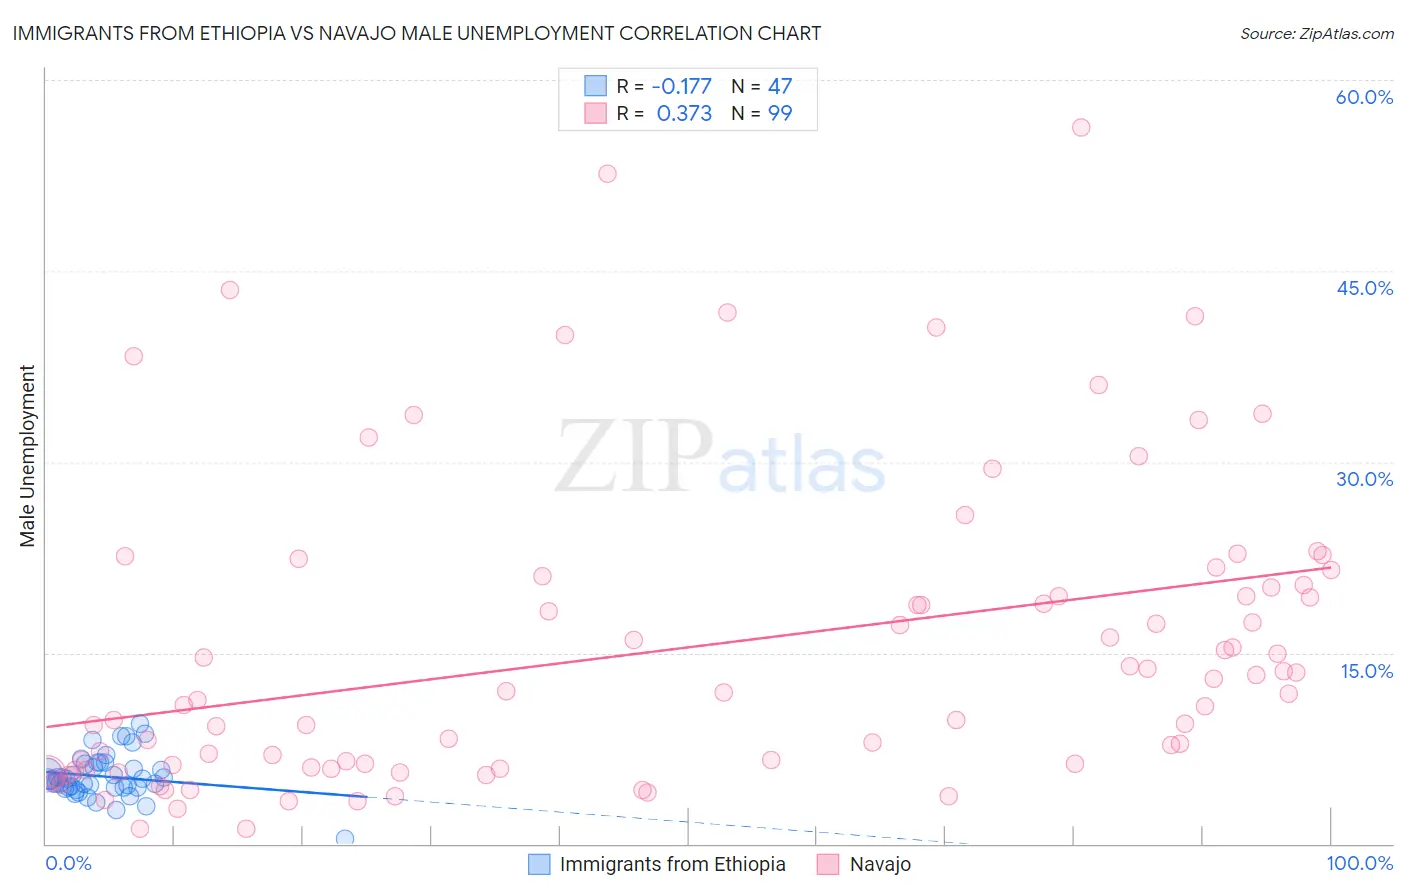
Immigrants from Ethiopia vs Navajo Male Unemployment Correlation Chart
The statistical analysis conducted on geographies consisting of 211,215,885 people shows a poor negative correlation between the proportion of Immigrants from Ethiopia and unemployment rate among males in the United States with a correlation coefficient (R) of -0.177 and weighted average of 5.1%. Similarly, the statistical analysis conducted on geographies consisting of 223,979,709 people shows a mild positive correlation between the proportion of Navajo and unemployment rate among males in the United States with a correlation coefficient (R) of 0.373 and weighted average of 9.8%, a difference of 92.3%.
Male Unemployment Correlation Summary
| Measurement | Immigrants from Ethiopia | Navajo |
| Minimum | 0.40% | 1.2% |
| Maximum | 9.4% | 56.3% |
| Range | 9.0% | 55.1% |
| Mean | 5.3% | 15.4% |
| Median | 5.1% | 11.9% |
| Interquartile 25% (IQ1) | 4.4% | 6.0% |
| Interquartile 75% (IQ3) | 6.2% | 20.4% |
| Interquartile Range (IQR) | 1.8% | 14.4% |
| Standard Deviation (Sample) | 1.7% | 12.0% |
| Standard Deviation (Population) | 1.7% | 11.9% |
Similar Demographics by Male Unemployment
Demographics Similar to Immigrants from Ethiopia by Male Unemployment
In terms of male unemployment, the demographic groups most similar to Immigrants from Ethiopia are Immigrants from Czechoslovakia (5.1%, a difference of 0.040%), Ethiopian (5.1%, a difference of 0.040%), Immigrants from Chile (5.1%, a difference of 0.050%), Immigrants from Nicaragua (5.1%, a difference of 0.050%), and Immigrants from Jordan (5.1%, a difference of 0.080%).
| Demographics | Rating | Rank | Male Unemployment |
| Uruguayans | 93.0 /100 | #99 | Exceptional 5.1% |
| Russians | 92.9 /100 | #100 | Exceptional 5.1% |
| German Russians | 92.7 /100 | #101 | Exceptional 5.1% |
| Immigrants | France | 92.7 /100 | #102 | Exceptional 5.1% |
| Immigrants | Jordan | 91.9 /100 | #103 | Exceptional 5.1% |
| Immigrants | Chile | 91.8 /100 | #104 | Exceptional 5.1% |
| Immigrants | Czechoslovakia | 91.7 /100 | #105 | Exceptional 5.1% |
| Immigrants | Ethiopia | 91.5 /100 | #106 | Exceptional 5.1% |
| Ethiopians | 91.3 /100 | #107 | Exceptional 5.1% |
| Immigrants | Nicaragua | 91.2 /100 | #108 | Exceptional 5.1% |
| Immigrants | Pakistan | 90.9 /100 | #109 | Exceptional 5.1% |
| Immigrants | England | 90.8 /100 | #110 | Exceptional 5.1% |
| Immigrants | Eastern Asia | 90.8 /100 | #111 | Exceptional 5.1% |
| Immigrants | Moldova | 90.3 /100 | #112 | Exceptional 5.1% |
| Immigrants | Austria | 90.3 /100 | #113 | Exceptional 5.1% |
Demographics Similar to Navajo by Male Unemployment
In terms of male unemployment, the demographic groups most similar to Navajo are Alaskan Athabascan (9.8%, a difference of 0.28%), Cheyenne (9.8%, a difference of 0.36%), Tohono O'odham (10.2%, a difference of 3.4%), Crow (10.6%, a difference of 7.9%), and Hopi (10.8%, a difference of 9.7%).
| Demographics | Rating | Rank | Male Unemployment |
| Sioux | 0.0 /100 | #333 | Tragic 8.4% |
| Tsimshian | 0.0 /100 | #334 | Tragic 8.5% |
| Pueblo | 0.0 /100 | #335 | Tragic 8.5% |
| Yuman | 0.0 /100 | #336 | Tragic 8.6% |
| Puerto Ricans | 0.0 /100 | #337 | Tragic 8.6% |
| Apache | 0.0 /100 | #338 | Tragic 8.6% |
| Cheyenne | 0.0 /100 | #339 | Tragic 9.8% |
| Alaskan Athabascans | 0.0 /100 | #340 | Tragic 9.8% |
| Navajo | 0.0 /100 | #341 | Tragic 9.8% |
| Tohono O'odham | 0.0 /100 | #342 | Tragic 10.2% |
| Crow | 0.0 /100 | #343 | Tragic 10.6% |
| Hopi | 0.0 /100 | #344 | Tragic 10.8% |
| Arapaho | 0.0 /100 | #345 | Tragic 11.0% |
| Inupiat | 0.0 /100 | #346 | Tragic 12.1% |
| Yup'ik | 0.0 /100 | #347 | Tragic 16.4% |