Hmong vs French Unemployment

COMPARE

Hmong
Race
Ancestry
AfghanAfricanAlaska NativeAlaskan AthabascanAlbanianAleutAlsatianAmericanApacheArabArapahoArgentineanArmenianAssyrian/Chaldean/SyriacAustralianAustrianBahamianBangladeshiBarbadianBasqueBelgianBelizeanBermudanBhutaneseBlackfeetBolivianBrazilianBritishBritish West IndianBulgarianBurmeseCajunCambodianCanadianCape VerdeanCarpatho RusynCelticCentral AmericanCentral American IndianCherokeeCheyenneChickasawChileanChineseChippewaChoctawColombianColvilleComancheCosta RicanCreeCreekCroatianCrowCubanCypriotCzechCzechoslovakianDanishDelawareDominicanDutchDutch West IndianEastern EuropeanEcuadorianEgyptianEnglishEstonianEthiopianEuropeanFijianFilipinoFinnishFrench American IndianFrench CanadianGermanGerman RussianGhanaianGreekGuamanian/ChamorroGuatemalanGuyaneseHaitianHmongHonduranHopiHoumaHungarianIcelanderIndian (Asian)IndonesianInupiatIranianIraqiIrishIroquoisIsraeliItalianJamaicanJapaneseJordanianKenyanKiowaKoreanLaotianLatvianLebaneseLiberianLithuanianLumbeeLuxembourgerMacedonianMalaysianMalteseMarshalleseMenomineeMexicanMexican American IndianMongolianMoroccanNative HawaiianNavajoNepaleseNew ZealanderNicaraguanNigerianNorthern EuropeanNorwegianOkinawanOsageOttawaPaiutePakistaniPalestinianPanamanianParaguayanPennsylvania GermanPeruvianPimaPolishPortuguesePotawatomiPuebloPuerto RicanPuget Sound SalishRomanianRussianSalvadoranSamoanScandinavianScotch-IrishScottishSeminoleSenegaleseSerbianShoshoneSierra LeoneanSiouxSlavicSlovakSloveneSomaliSouth AfricanSouth AmericanSouth American IndianSoviet UnionSpaniardSpanishSpanish AmericanSpanish American IndianSri LankanSubsaharan AfricanSudaneseSwedishSwissSyrianTaiwaneseThaiTlingit-HaidaTohono O'OdhamTonganTrinidadian and TobagonianTsimshianTurkishU.S. Virgin IslanderUgandanUkrainianUruguayanUteVenezuelanVietnameseWelshWest IndianYakamaYaquiYugoslavianYumanYup'ikZimbabwean
Immigration
NonimmigrantsImmigrantsAfghanistanAfricaAlbaniaArgentinaArmeniaAsiaAustraliaAustriaBahamasBangladeshBarbadosBelarusBelgiumBelizeBoliviaBosnia and HerzegovinaBrazilBulgariaBurma/MyanmarCabo VerdeCambodiaCameroonCanadaCaribbeanCentral AmericaChileChinaColombiaCongoCosta RicaCroatiaCubaCzechoslovakiaDenmarkDominicaDominican RepublicEastern AfricaEastern AsiaEastern EuropeEcuadorEgyptEl SalvadorEnglandEritreaEthiopiaEuropeFijiFranceGermanyGhanaGreeceGrenadaGuatemalaGuyanaHaitiHondurasHong KongHungaryIndiaIndonesiaIranIraqIrelandIsraelItalyJamaicaJapanJordanKazakhstanKenyaKoreaKuwaitLaosLatin AmericaLatviaLebanonLiberiaLithuaniaMalaysiaMexicoMicronesiaMiddle AfricaMoldovaMoroccoNepalNetherlandsNicaraguaNigeriaNorth AmericaNorth MacedoniaNorthern AfricaNorthern EuropeNorwayOceaniaPakistanPanamaPeruPhilippinesPolandPortugalRomaniaRussiaSaudi ArabiaScotlandSenegalSerbiaSierra LeoneSingaporeSomaliaSouth AfricaSouth AmericaSouth Central AsiaSouth Eastern AsiaSouthern EuropeSpainSri LankaSt. Vincent and the GrenadinesSudanSwedenSwitzerlandSyriaTaiwanThailandTrinidad and TobagoTurkeyUgandaUkraineUruguayUzbekistanVenezuelaVietnamWest IndiesWestern AfricaWestern AsiaWestern EuropeYemenZaireZimbabweAzores
French
Race
Ancestry
AfghanAfricanAlaska NativeAlaskan AthabascanAlbanianAleutAlsatianAmericanApacheArabArapahoArgentineanArmenianAssyrian/Chaldean/SyriacAustralianAustrianBahamianBangladeshiBarbadianBasqueBelgianBelizeanBermudanBhutaneseBlackfeetBolivianBrazilianBritishBritish West IndianBulgarianBurmeseCajunCambodianCanadianCape VerdeanCarpatho RusynCelticCentral AmericanCentral American IndianCherokeeCheyenneChickasawChileanChineseChippewaChoctawColombianColvilleComancheCosta RicanCreeCreekCroatianCrowCubanCypriotCzechCzechoslovakianDanishDelawareDominicanDutchDutch West IndianEastern EuropeanEcuadorianEgyptianEnglishEstonianEthiopianEuropeanFijianFilipinoFinnishFrenchFrench American IndianFrench CanadianGermanGerman RussianGhanaianGreekGuamanian/ChamorroGuatemalanGuyaneseHaitianHonduranHopiHoumaHungarianIcelanderIndian (Asian)IndonesianInupiatIranianIraqiIrishIroquoisIsraeliItalianJamaicanJapaneseJordanianKenyanKiowaKoreanLaotianLatvianLebaneseLiberianLithuanianLumbeeLuxembourgerMacedonianMalaysianMalteseMarshalleseMenomineeMexicanMexican American IndianMongolianMoroccanNative HawaiianNavajoNepaleseNew ZealanderNicaraguanNigerianNorthern EuropeanNorwegianOkinawanOsageOttawaPaiutePakistaniPalestinianPanamanianParaguayanPennsylvania GermanPeruvianPimaPolishPortuguesePotawatomiPuebloPuerto RicanPuget Sound SalishRomanianRussianSalvadoranSamoanScandinavianScotch-IrishScottishSeminoleSenegaleseSerbianShoshoneSierra LeoneanSiouxSlavicSlovakSloveneSomaliSouth AfricanSouth AmericanSouth American IndianSoviet UnionSpaniardSpanishSpanish AmericanSpanish American IndianSri LankanSubsaharan AfricanSudaneseSwedishSwissSyrianTaiwaneseThaiTlingit-HaidaTohono O'OdhamTonganTrinidadian and TobagonianTsimshianTurkishU.S. Virgin IslanderUgandanUkrainianUruguayanUteVenezuelanVietnameseWelshWest IndianYakamaYaquiYugoslavianYumanYup'ikZimbabwean
Immigration
NonimmigrantsImmigrantsAfghanistanAfricaAlbaniaArgentinaArmeniaAsiaAustraliaAustriaBahamasBangladeshBarbadosBelarusBelgiumBelizeBoliviaBosnia and HerzegovinaBrazilBulgariaBurma/MyanmarCabo VerdeCambodiaCameroonCanadaCaribbeanCentral AmericaChileChinaColombiaCongoCosta RicaCroatiaCubaCzechoslovakiaDenmarkDominicaDominican RepublicEastern AfricaEastern AsiaEastern EuropeEcuadorEgyptEl SalvadorEnglandEritreaEthiopiaEuropeFijiFranceGermanyGhanaGreeceGrenadaGuatemalaGuyanaHaitiHondurasHong KongHungaryIndiaIndonesiaIranIraqIrelandIsraelItalyJamaicaJapanJordanKazakhstanKenyaKoreaKuwaitLaosLatin AmericaLatviaLebanonLiberiaLithuaniaMalaysiaMexicoMicronesiaMiddle AfricaMoldovaMoroccoNepalNetherlandsNicaraguaNigeriaNorth AmericaNorth MacedoniaNorthern AfricaNorthern EuropeNorwayOceaniaPakistanPanamaPeruPhilippinesPolandPortugalRomaniaRussiaSaudi ArabiaScotlandSenegalSerbiaSierra LeoneSingaporeSomaliaSouth AfricaSouth AmericaSouth Central AsiaSouth Eastern AsiaSouthern EuropeSpainSri LankaSt. Vincent and the GrenadinesSudanSwedenSwitzerlandSyriaTaiwanThailandTrinidad and TobagoTurkeyUgandaUkraineUruguayUzbekistanVenezuelaVietnamWest IndiesWestern AfricaWestern AsiaWestern EuropeYemenZaireZimbabweAzores
Unemployment
Income
Poverty
Unemployment
Labor Participation
Family Structure
Vehicle Availability
Education Level
Disability

Unemployment Comparison

Hmong

French

Exceptional
Exceptional
5.0%
UNEMPLOYMENT
97.6/ 100
METRIC RATING
83rd/ 347
METRIC RANK
4.8%
UNEMPLOYMENT
99.5/ 100
METRIC RATING
45th/ 347
METRIC RANK

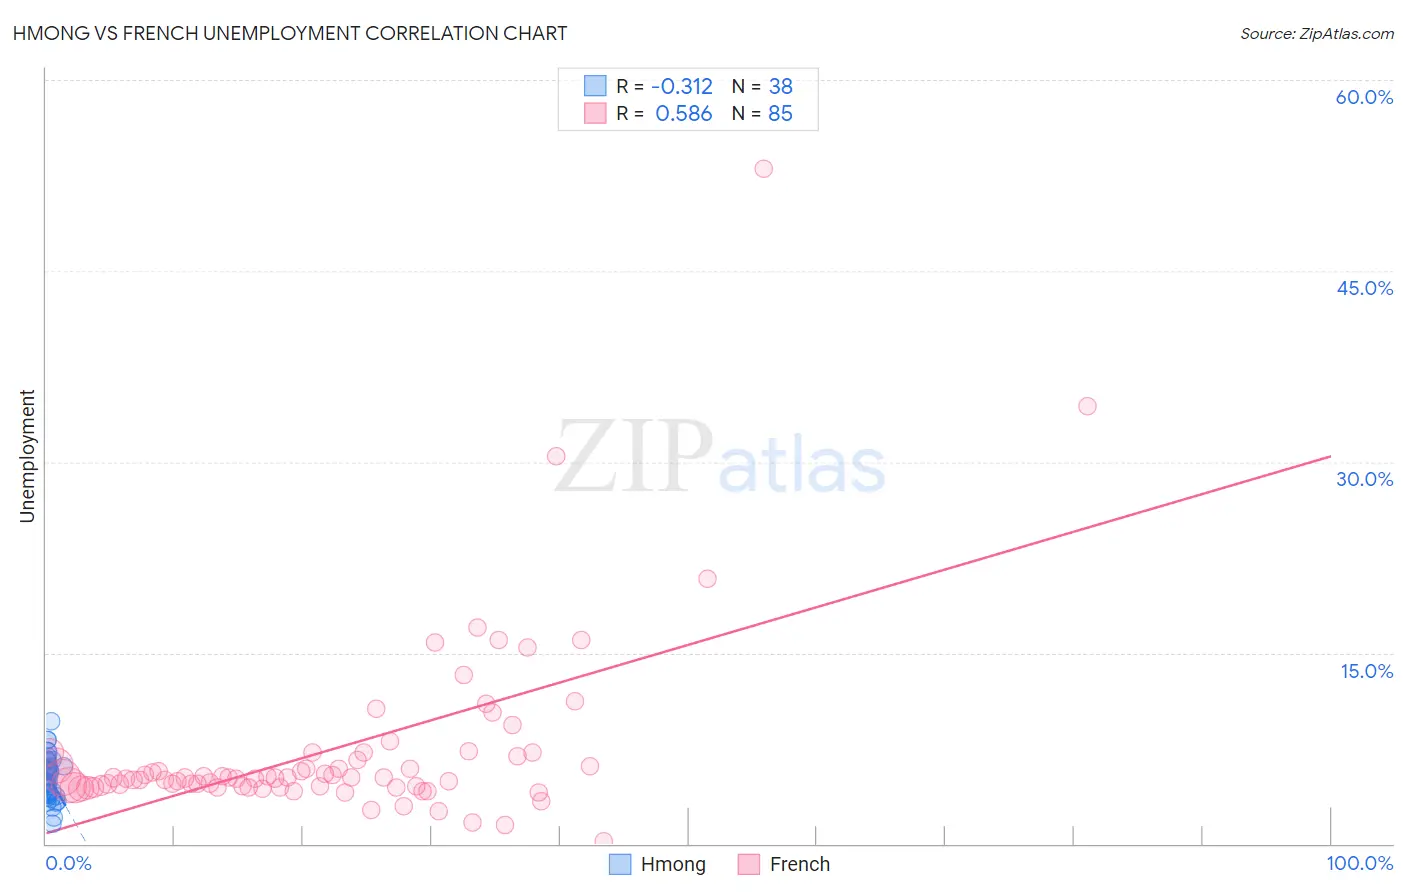
Hmong vs French Unemployment Correlation Chart

The statistical analysis conducted on geographies consisting of 24,672,093 people shows a mild negative correlation between the proportion of Hmong and unemployment in the United States with a correlation coefficient (R) of -0.312 and weighted average of 5.0%. Similarly, the statistical analysis conducted on geographies consisting of 568,292,844 people shows a substantial positive correlation between the proportion of French and unemployment in the United States with a correlation coefficient (R) of 0.586 and weighted average of 4.8%, a difference of 2.5%.
Hmong vs French Unemployment

Unemployment Correlation Summary

MeasurementHmongFrench
Minimum1.6%0.20%
Maximum9.6%53.0%
Range8.0%52.8%
Mean5.2%7.4%
Median5.3%5.2%
Interquartile 25% (IQ1)3.8%4.5%
Interquartile 75% (IQ3)6.5%7.0%
Interquartile Range (IQR)2.7%2.5%
Standard Deviation (Sample)1.8%7.3%
Standard Deviation (Population)1.7%7.3%

Similar Demographics by Unemployment

Demographics Similar to Hmong by Unemployment

In terms of unemployment, the demographic groups most similar to Hmong are Fijian (5.0%, a difference of 0.010%), Basque (5.0%, a difference of 0.020%), Immigrants from Sweden (5.0%, a difference of 0.030%), Russian (5.0%, a difference of 0.080%), and Canadian (5.0%, a difference of 0.10%).
DemographicsRating | RankUnemployment
German Russians
98.0
/100
|
#76
Exceptional
4.9%
Cypriots
97.9
/100
|
#77
Exceptional
4.9%
Okinawans
97.9
/100
|
#78
Exceptional
4.9%
Canadians
97.7
/100
|
#79
Exceptional
5.0%
Immigrants | Sweden
97.6
/100
|
#80
Exceptional
5.0%
Basques
97.6
/100
|
#81
Exceptional
5.0%
Fijians
97.6
/100
|
#82
Exceptional
5.0%
Hmong
97.6
/100
|
#83
Exceptional
5.0%
Russians
97.4
/100
|
#84
Exceptional
5.0%
Immigrants | Australia
97.0
/100
|
#85
Exceptional
5.0%
Hungarians
96.9
/100
|
#86
Exceptional
5.0%
Immigrants | Moldova
96.6
/100
|
#87
Exceptional
5.0%
Immigrants | Korea
96.6
/100
|
#88
Exceptional
5.0%
Jordanians
96.4
/100
|
#89
Exceptional
5.0%
Immigrants | North Macedonia
96.3
/100
|
#90
Exceptional
5.0%

Demographics Similar to French by Unemployment

In terms of unemployment, the demographic groups most similar to French are Austrian (4.8%, a difference of 0.050%), Yugoslavian (4.8%, a difference of 0.11%), Immigrants from Nepal (4.8%, a difference of 0.16%), Immigrants from Taiwan (4.8%, a difference of 0.18%), and Filipino (4.8%, a difference of 0.31%).
DemographicsRating | RankUnemployment
Bolivians
99.7
/100
|
#38
Exceptional
4.8%
Lithuanians
99.7
/100
|
#39
Exceptional
4.8%
Northern Europeans
99.7
/100
|
#40
Exceptional
4.8%
Immigrants | Bosnia and Herzegovina
99.7
/100
|
#41
Exceptional
4.8%
Filipinos
99.5
/100
|
#42
Exceptional
4.8%
Yugoslavians
99.5
/100
|
#43
Exceptional
4.8%
Austrians
99.5
/100
|
#44
Exceptional
4.8%
French
99.5
/100
|
#45
Exceptional
4.8%
Immigrants | Nepal
99.4
/100
|
#46
Exceptional
4.8%
Immigrants | Taiwan
99.4
/100
|
#47
Exceptional
4.8%
Immigrants | Scotland
99.3
/100
|
#48
Exceptional
4.9%
Immigrants | South Central Asia
99.3
/100
|
#49
Exceptional
4.9%
French Canadians
99.3
/100
|
#50
Exceptional
4.9%
Immigrants | Belgium
99.2
/100
|
#51
Exceptional
4.9%
Whites/Caucasians
99.2
/100
|
#52
Exceptional
4.9%