Hmong vs Immigrants from Bulgaria Unemployment
COMPARE
Hmong
Immigrants from Bulgaria
Unemployment
Unemployment Comparison
Hmong
Immigrants from Bulgaria
5.0%
UNEMPLOYMENT
97.6/ 100
METRIC RATING
83rd/ 347
METRIC RANK
4.9%
UNEMPLOYMENT
98.9/ 100
METRIC RATING
63rd/ 347
METRIC RANK
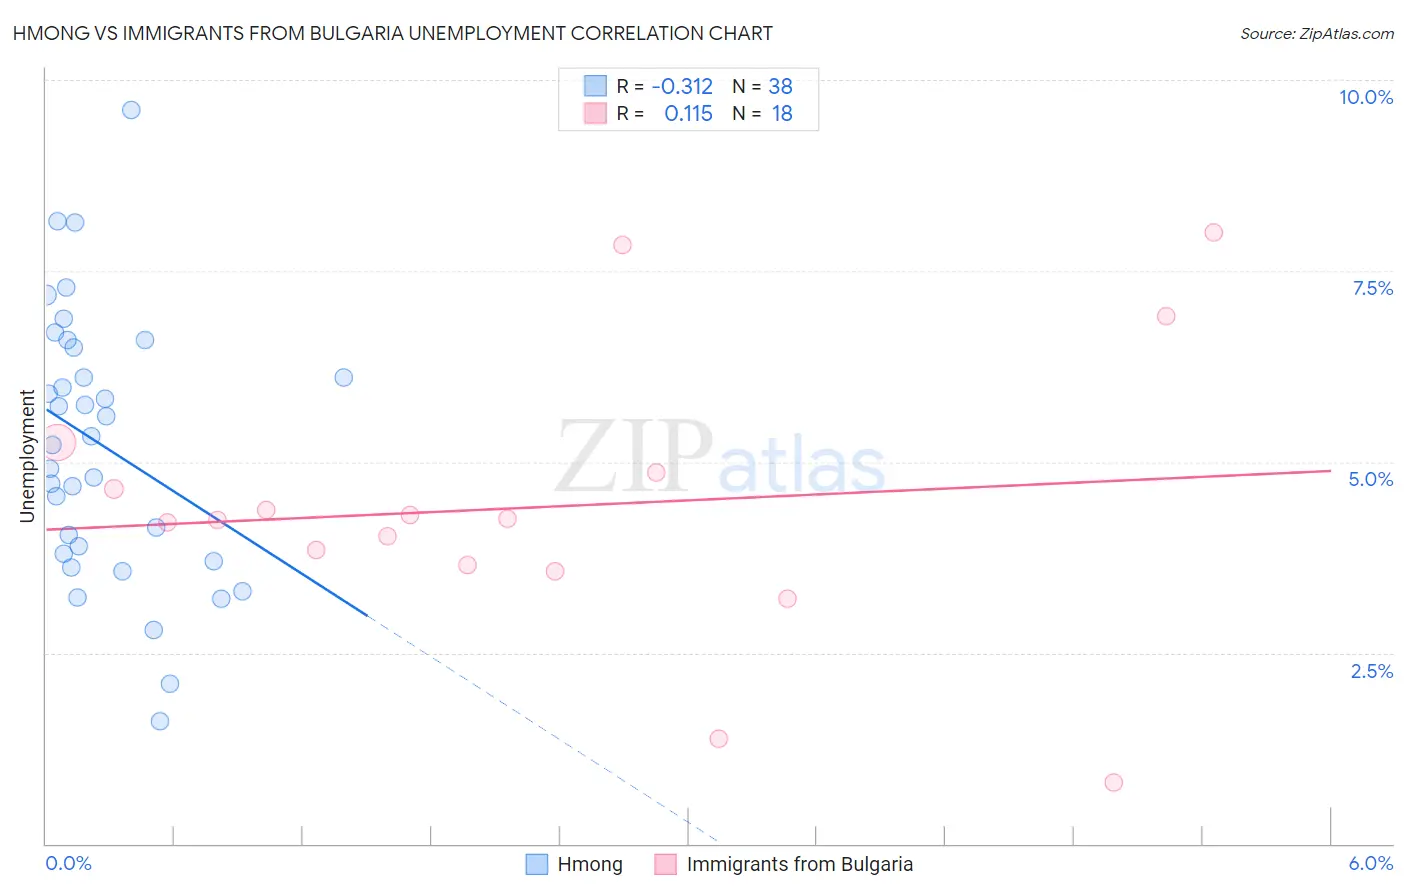
Hmong vs Immigrants from Bulgaria Unemployment Correlation Chart
The statistical analysis conducted on geographies consisting of 24,672,093 people shows a mild negative correlation between the proportion of Hmong and unemployment in the United States with a correlation coefficient (R) of -0.312 and weighted average of 5.0%. Similarly, the statistical analysis conducted on geographies consisting of 172,511,279 people shows a poor positive correlation between the proportion of Immigrants from Bulgaria and unemployment in the United States with a correlation coefficient (R) of 0.115 and weighted average of 4.9%, a difference of 1.4%.
Unemployment Correlation Summary
| Measurement | Hmong | Immigrants from Bulgaria |
| Minimum | 1.6% | 0.80% |
| Maximum | 9.6% | 8.0% |
| Range | 8.0% | 7.2% |
| Mean | 5.2% | 4.4% |
| Median | 5.3% | 4.2% |
| Interquartile 25% (IQ1) | 3.8% | 3.6% |
| Interquartile 75% (IQ3) | 6.5% | 4.9% |
| Interquartile Range (IQR) | 2.7% | 1.2% |
| Standard Deviation (Sample) | 1.8% | 1.8% |
| Standard Deviation (Population) | 1.7% | 1.8% |
Demographics Similar to Hmong and Immigrants from Bulgaria by Unemployment
In terms of unemployment, the demographic groups most similar to Hmong are Fijian (5.0%, a difference of 0.010%), Basque (5.0%, a difference of 0.020%), Immigrants from Sweden (5.0%, a difference of 0.030%), Canadian (5.0%, a difference of 0.10%), and Okinawan (4.9%, a difference of 0.22%). Similarly, the demographic groups most similar to Immigrants from Bulgaria are Italian (4.9%, a difference of 0.080%), Immigrants from Canada (4.9%, a difference of 0.23%), Slovak (4.9%, a difference of 0.38%), New Zealander (4.9%, a difference of 0.41%), and Slavic (4.9%, a difference of 0.44%).
| Demographics | Rating | Rank | Unemployment |
| Immigrants | Bulgaria | 98.9 /100 | #63 | Exceptional 4.9% |
| Italians | 98.9 /100 | #64 | Exceptional 4.9% |
| Immigrants | Canada | 98.8 /100 | #65 | Exceptional 4.9% |
| Slovaks | 98.7 /100 | #66 | Exceptional 4.9% |
| New Zealanders | 98.6 /100 | #67 | Exceptional 4.9% |
| Slavs | 98.6 /100 | #68 | Exceptional 4.9% |
| Immigrants | North America | 98.5 /100 | #69 | Exceptional 4.9% |
| Serbians | 98.4 /100 | #70 | Exceptional 4.9% |
| Immigrants | Japan | 98.3 /100 | #71 | Exceptional 4.9% |
| Burmese | 98.3 /100 | #72 | Exceptional 4.9% |
| Paraguayans | 98.3 /100 | #73 | Exceptional 4.9% |
| Immigrants | Northern Europe | 98.2 /100 | #74 | Exceptional 4.9% |
| Turks | 98.0 /100 | #75 | Exceptional 4.9% |
| German Russians | 98.0 /100 | #76 | Exceptional 4.9% |
| Cypriots | 97.9 /100 | #77 | Exceptional 4.9% |
| Okinawans | 97.9 /100 | #78 | Exceptional 4.9% |
| Canadians | 97.7 /100 | #79 | Exceptional 5.0% |
| Immigrants | Sweden | 97.6 /100 | #80 | Exceptional 5.0% |
| Basques | 97.6 /100 | #81 | Exceptional 5.0% |
| Fijians | 97.6 /100 | #82 | Exceptional 5.0% |
| Hmong | 97.6 /100 | #83 | Exceptional 5.0% |