Greek vs Immigrants from Cuba Seniors Poverty Over the Age of 65
COMPARE
Greek
Immigrants from Cuba
Seniors Poverty Over the Age of 65
Seniors Poverty Over the Age of 65 Comparison
Greeks
Immigrants from Cuba
9.6%
SENIORS POVERTY OVER THE AGE OF 65
99.6/ 100
METRIC RATING
39th/ 347
METRIC RANK
17.9%
SENIORS POVERTY OVER THE AGE OF 65
0.0/ 100
METRIC RATING
342nd/ 347
METRIC RANK
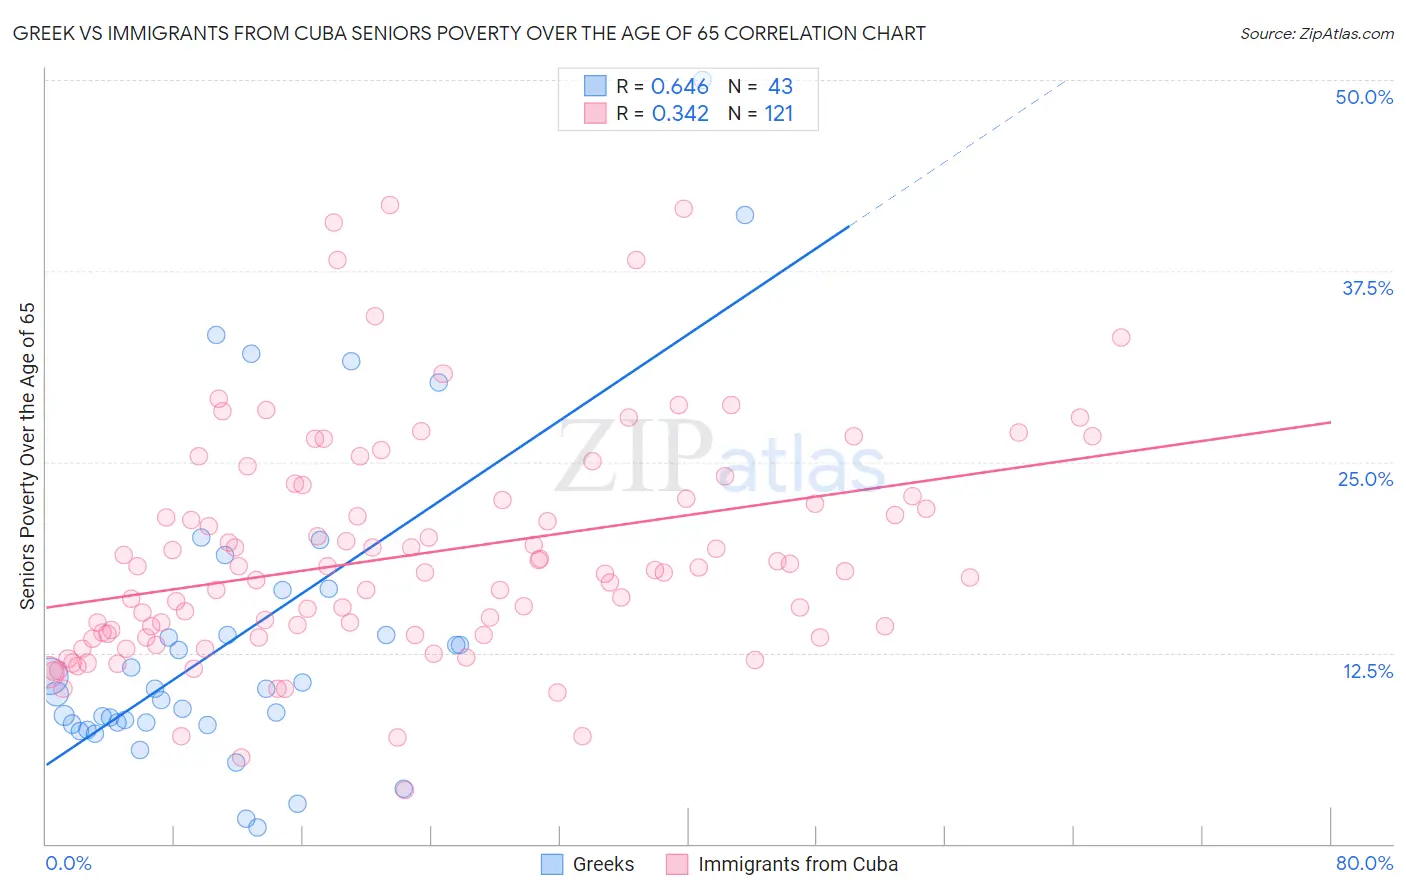
Greek vs Immigrants from Cuba Seniors Poverty Over the Age of 65 Correlation Chart
The statistical analysis conducted on geographies consisting of 480,237,889 people shows a significant positive correlation between the proportion of Greeks and poverty level among seniors over the age of 65 in the United States with a correlation coefficient (R) of 0.646 and weighted average of 9.6%. Similarly, the statistical analysis conducted on geographies consisting of 325,352,793 people shows a mild positive correlation between the proportion of Immigrants from Cuba and poverty level among seniors over the age of 65 in the United States with a correlation coefficient (R) of 0.342 and weighted average of 17.9%, a difference of 87.5%.
Seniors Poverty Over the Age of 65 Correlation Summary
| Measurement | Greek | Immigrants from Cuba |
| Minimum | 1.0% | 3.5% |
| Maximum | 50.0% | 41.8% |
| Range | 49.0% | 38.3% |
| Mean | 13.7% | 18.9% |
| Median | 10.1% | 17.9% |
| Interquartile 25% (IQ1) | 7.8% | 13.7% |
| Interquartile 75% (IQ3) | 16.6% | 22.6% |
| Interquartile Range (IQR) | 8.8% | 8.9% |
| Standard Deviation (Sample) | 10.6% | 7.5% |
| Standard Deviation (Population) | 10.4% | 7.4% |
Similar Demographics by Seniors Poverty Over the Age of 65
Demographics Similar to Greeks by Seniors Poverty Over the Age of 65
In terms of seniors poverty over the age of 65, the demographic groups most similar to Greeks are Assyrian/Chaldean/Syriac (9.6%, a difference of 0.12%), Immigrants from North Macedonia (9.6%, a difference of 0.28%), Zimbabwean (9.6%, a difference of 0.44%), Eastern European (9.6%, a difference of 0.54%), and Belgian (9.5%, a difference of 0.63%).
| Demographics | Rating | Rank | Seniors Poverty Over the Age of 65 |
| Northern Europeans | 99.8 /100 | #32 | Exceptional 9.4% |
| Native Hawaiians | 99.8 /100 | #33 | Exceptional 9.4% |
| British | 99.8 /100 | #34 | Exceptional 9.4% |
| Latvians | 99.8 /100 | #35 | Exceptional 9.5% |
| Czechoslovakians | 99.8 /100 | #36 | Exceptional 9.5% |
| Scotch-Irish | 99.7 /100 | #37 | Exceptional 9.5% |
| Belgians | 99.7 /100 | #38 | Exceptional 9.5% |
| Greeks | 99.6 /100 | #39 | Exceptional 9.6% |
| Assyrians/Chaldeans/Syriacs | 99.6 /100 | #40 | Exceptional 9.6% |
| Immigrants | North Macedonia | 99.6 /100 | #41 | Exceptional 9.6% |
| Zimbabweans | 99.6 /100 | #42 | Exceptional 9.6% |
| Eastern Europeans | 99.6 /100 | #43 | Exceptional 9.6% |
| Austrians | 99.5 /100 | #44 | Exceptional 9.6% |
| Estonians | 99.5 /100 | #45 | Exceptional 9.6% |
| Immigrants | Taiwan | 99.5 /100 | #46 | Exceptional 9.7% |
Demographics Similar to Immigrants from Cuba by Seniors Poverty Over the Age of 65
In terms of seniors poverty over the age of 65, the demographic groups most similar to Immigrants from Cuba are Dominican (17.8%, a difference of 0.48%), Hopi (17.8%, a difference of 0.87%), Lumbee (18.1%, a difference of 1.1%), Immigrants from Dominican Republic (18.3%, a difference of 2.0%), and Navajo (17.5%, a difference of 2.8%).
| Demographics | Rating | Rank | Seniors Poverty Over the Age of 65 |
| Immigrants | Yemen | 0.0 /100 | #333 | Tragic 15.9% |
| Immigrants | Nicaragua | 0.0 /100 | #334 | Tragic 15.9% |
| Cubans | 0.0 /100 | #335 | Tragic 16.1% |
| Immigrants | Cabo Verde | 0.0 /100 | #336 | Tragic 16.2% |
| Immigrants | Caribbean | 0.0 /100 | #337 | Tragic 16.5% |
| Pueblo | 0.0 /100 | #338 | Tragic 17.2% |
| Navajo | 0.0 /100 | #339 | Tragic 17.5% |
| Hopi | 0.0 /100 | #340 | Tragic 17.8% |
| Dominicans | 0.0 /100 | #341 | Tragic 17.8% |
| Immigrants | Cuba | 0.0 /100 | #342 | Tragic 17.9% |
| Lumbee | 0.0 /100 | #343 | Tragic 18.1% |
| Immigrants | Dominican Republic | 0.0 /100 | #344 | Tragic 18.3% |
| Pima | 0.0 /100 | #345 | Tragic 19.8% |
| Tohono O'odham | 0.0 /100 | #346 | Tragic 20.8% |
| Puerto Ricans | 0.0 /100 | #347 | Tragic 21.4% |