German vs Bermudan Unemployment
COMPARE
German
Bermudan
Unemployment
Unemployment Comparison
Germans
Bermudans
4.5%
UNEMPLOYMENT
100.0/ 100
METRIC RATING
6th/ 347
METRIC RANK
5.6%
UNEMPLOYMENT
1.1/ 100
METRIC RATING
246th/ 347
METRIC RANK
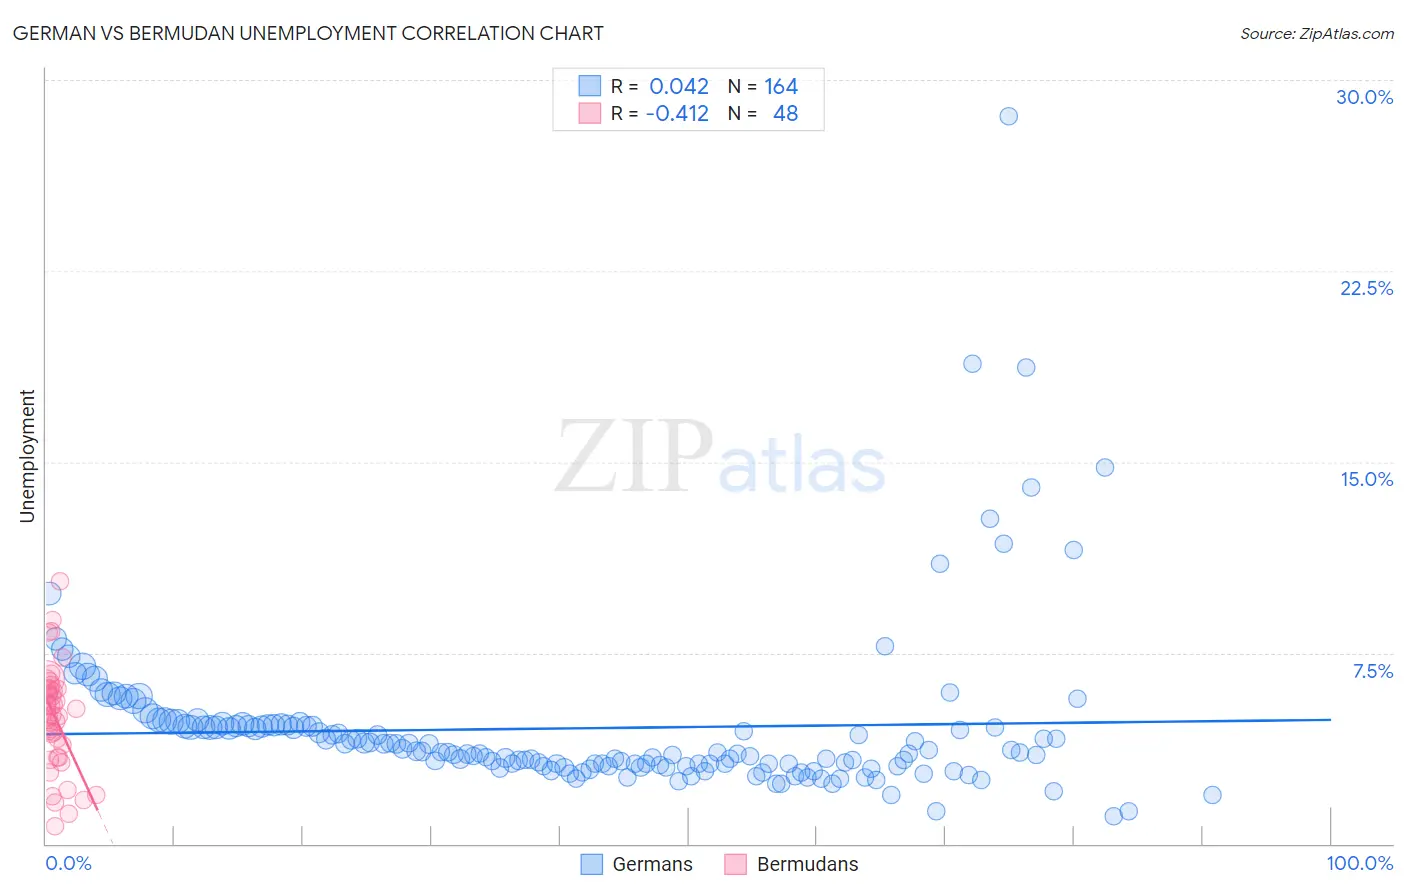
German vs Bermudan Unemployment Correlation Chart
The statistical analysis conducted on geographies consisting of 575,448,590 people shows no correlation between the proportion of Germans and unemployment in the United States with a correlation coefficient (R) of 0.042 and weighted average of 4.5%. Similarly, the statistical analysis conducted on geographies consisting of 55,703,293 people shows a moderate negative correlation between the proportion of Bermudans and unemployment in the United States with a correlation coefficient (R) of -0.412 and weighted average of 5.6%, a difference of 25.3%.
Unemployment Correlation Summary
| Measurement | German | Bermudan |
| Minimum | 1.1% | 0.70% |
| Maximum | 28.6% | 10.3% |
| Range | 27.5% | 9.6% |
| Mean | 4.5% | 4.9% |
| Median | 3.6% | 5.1% |
| Interquartile 25% (IQ1) | 3.1% | 3.6% |
| Interquartile 75% (IQ3) | 4.6% | 6.1% |
| Interquartile Range (IQR) | 1.6% | 2.4% |
| Standard Deviation (Sample) | 3.3% | 2.0% |
| Standard Deviation (Population) | 3.2% | 2.0% |
Similar Demographics by Unemployment
Demographics Similar to Germans by Unemployment
In terms of unemployment, the demographic groups most similar to Germans are Immigrants from India (4.5%, a difference of 0.55%), Swedish (4.4%, a difference of 0.79%), Swiss (4.5%, a difference of 1.0%), Scandinavian (4.5%, a difference of 1.4%), and Dutch (4.6%, a difference of 1.9%).
| Demographics | Rating | Rank | Unemployment |
| Norwegians | 100.0 /100 | #1 | Exceptional 4.2% |
| Luxembourgers | 100.0 /100 | #2 | Exceptional 4.3% |
| Czechs | 100.0 /100 | #3 | Exceptional 4.3% |
| Danes | 100.0 /100 | #4 | Exceptional 4.3% |
| Swedes | 100.0 /100 | #5 | Exceptional 4.4% |
| Germans | 100.0 /100 | #6 | Exceptional 4.5% |
| Immigrants | India | 100.0 /100 | #7 | Exceptional 4.5% |
| Swiss | 100.0 /100 | #8 | Exceptional 4.5% |
| Scandinavians | 100.0 /100 | #9 | Exceptional 4.5% |
| Dutch | 100.0 /100 | #10 | Exceptional 4.6% |
| English | 100.0 /100 | #11 | Exceptional 4.6% |
| Pennsylvania Germans | 100.0 /100 | #12 | Exceptional 4.6% |
| Belgians | 100.0 /100 | #13 | Exceptional 4.6% |
| Immigrants | Cuba | 100.0 /100 | #14 | Exceptional 4.6% |
| Europeans | 99.9 /100 | #15 | Exceptional 4.6% |
Demographics Similar to Bermudans by Unemployment
In terms of unemployment, the demographic groups most similar to Bermudans are French American Indian (5.6%, a difference of 0.050%), Dutch West Indian (5.6%, a difference of 0.070%), Immigrants from Cameroon (5.6%, a difference of 0.15%), Marshallese (5.6%, a difference of 0.22%), and Liberian (5.6%, a difference of 0.28%).
| Demographics | Rating | Rank | Unemployment |
| Immigrants | Immigrants | 2.6 /100 | #239 | Tragic 5.5% |
| Cree | 2.6 /100 | #240 | Tragic 5.6% |
| Tlingit-Haida | 2.0 /100 | #241 | Tragic 5.6% |
| Spanish Americans | 2.0 /100 | #242 | Tragic 5.6% |
| Marshallese | 1.3 /100 | #243 | Tragic 5.6% |
| Dutch West Indians | 1.2 /100 | #244 | Tragic 5.6% |
| French American Indians | 1.2 /100 | #245 | Tragic 5.6% |
| Bermudans | 1.1 /100 | #246 | Tragic 5.6% |
| Immigrants | Cameroon | 1.0 /100 | #247 | Tragic 5.6% |
| Liberians | 0.9 /100 | #248 | Tragic 5.6% |
| Cajuns | 0.8 /100 | #249 | Tragic 5.6% |
| Japanese | 0.8 /100 | #250 | Tragic 5.6% |
| Kiowa | 0.6 /100 | #251 | Tragic 5.7% |
| Hondurans | 0.3 /100 | #252 | Tragic 5.7% |
| Central Americans | 0.3 /100 | #253 | Tragic 5.7% |