Immigrants from Ethiopia vs Bermudan Unemployment
COMPARE
Immigrants from Ethiopia
Bermudan
Unemployment
Unemployment Comparison
Immigrants from Ethiopia
Bermudans
5.1%
UNEMPLOYMENT
86.7/ 100
METRIC RATING
132nd/ 347
METRIC RANK
5.6%
UNEMPLOYMENT
1.1/ 100
METRIC RATING
246th/ 347
METRIC RANK
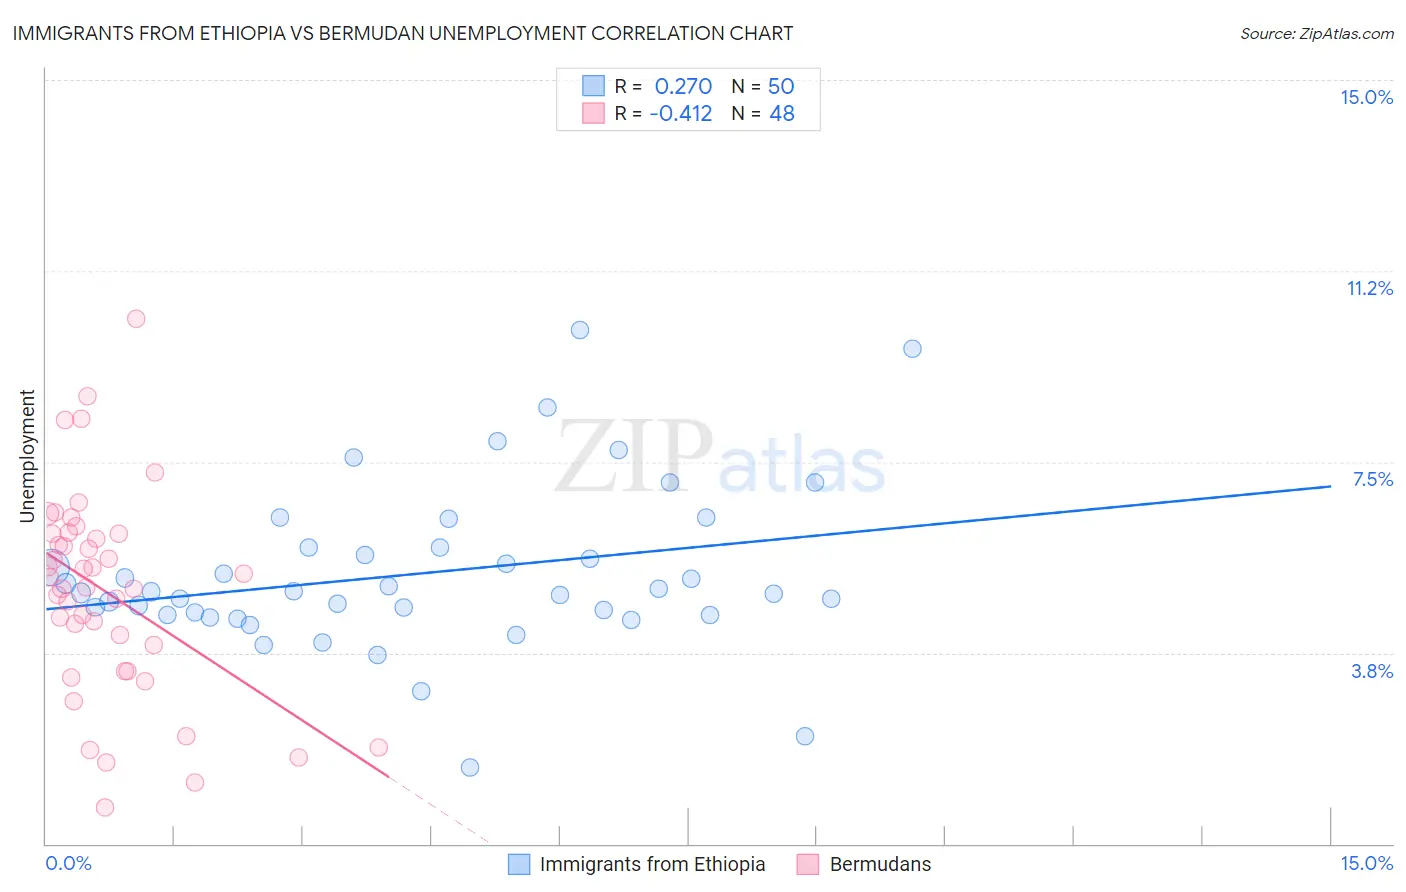
Immigrants from Ethiopia vs Bermudan Unemployment Correlation Chart
The statistical analysis conducted on geographies consisting of 211,490,952 people shows a weak positive correlation between the proportion of Immigrants from Ethiopia and unemployment in the United States with a correlation coefficient (R) of 0.270 and weighted average of 5.1%. Similarly, the statistical analysis conducted on geographies consisting of 55,703,293 people shows a moderate negative correlation between the proportion of Bermudans and unemployment in the United States with a correlation coefficient (R) of -0.412 and weighted average of 5.6%, a difference of 10.0%.
Unemployment Correlation Summary
| Measurement | Immigrants from Ethiopia | Bermudan |
| Minimum | 1.5% | 0.70% |
| Maximum | 10.1% | 10.3% |
| Range | 8.6% | 9.6% |
| Mean | 5.3% | 4.9% |
| Median | 4.9% | 5.1% |
| Interquartile 25% (IQ1) | 4.5% | 3.6% |
| Interquartile 75% (IQ3) | 5.8% | 6.1% |
| Interquartile Range (IQR) | 1.3% | 2.4% |
| Standard Deviation (Sample) | 1.6% | 2.0% |
| Standard Deviation (Population) | 1.6% | 2.0% |
Similar Demographics by Unemployment
Demographics Similar to Immigrants from Ethiopia by Unemployment
In terms of unemployment, the demographic groups most similar to Immigrants from Ethiopia are Immigrants from Croatia (5.1%, a difference of 0.010%), Immigrants from Jordan (5.1%, a difference of 0.010%), Iranian (5.1%, a difference of 0.030%), Immigrants from Europe (5.1%, a difference of 0.050%), and Immigrants from Burma/Myanmar (5.1%, a difference of 0.060%).
| Demographics | Rating | Rank | Unemployment |
| Immigrants | Eastern Asia | 88.3 /100 | #125 | Excellent 5.1% |
| Kenyans | 88.2 /100 | #126 | Excellent 5.1% |
| Immigrants | Kenya | 88.2 /100 | #127 | Excellent 5.1% |
| Immigrants | Eastern Africa | 88.1 /100 | #128 | Excellent 5.1% |
| Immigrants | Latvia | 88.0 /100 | #129 | Excellent 5.1% |
| Iranians | 86.9 /100 | #130 | Excellent 5.1% |
| Immigrants | Croatia | 86.8 /100 | #131 | Excellent 5.1% |
| Immigrants | Ethiopia | 86.7 /100 | #132 | Excellent 5.1% |
| Immigrants | Jordan | 86.6 /100 | #133 | Excellent 5.1% |
| Immigrants | Europe | 86.3 /100 | #134 | Excellent 5.1% |
| Immigrants | Burma/Myanmar | 86.2 /100 | #135 | Excellent 5.1% |
| Immigrants | Spain | 86.2 /100 | #136 | Excellent 5.1% |
| Immigrants | Saudi Arabia | 85.6 /100 | #137 | Excellent 5.1% |
| Immigrants | Hungary | 85.6 /100 | #138 | Excellent 5.1% |
| Pakistanis | 85.3 /100 | #139 | Excellent 5.1% |
Demographics Similar to Bermudans by Unemployment
In terms of unemployment, the demographic groups most similar to Bermudans are French American Indian (5.6%, a difference of 0.050%), Dutch West Indian (5.6%, a difference of 0.070%), Immigrants from Cameroon (5.6%, a difference of 0.15%), Marshallese (5.6%, a difference of 0.22%), and Liberian (5.6%, a difference of 0.28%).
| Demographics | Rating | Rank | Unemployment |
| Immigrants | Immigrants | 2.6 /100 | #239 | Tragic 5.5% |
| Cree | 2.6 /100 | #240 | Tragic 5.6% |
| Tlingit-Haida | 2.0 /100 | #241 | Tragic 5.6% |
| Spanish Americans | 2.0 /100 | #242 | Tragic 5.6% |
| Marshallese | 1.3 /100 | #243 | Tragic 5.6% |
| Dutch West Indians | 1.2 /100 | #244 | Tragic 5.6% |
| French American Indians | 1.2 /100 | #245 | Tragic 5.6% |
| Bermudans | 1.1 /100 | #246 | Tragic 5.6% |
| Immigrants | Cameroon | 1.0 /100 | #247 | Tragic 5.6% |
| Liberians | 0.9 /100 | #248 | Tragic 5.6% |
| Cajuns | 0.8 /100 | #249 | Tragic 5.6% |
| Japanese | 0.8 /100 | #250 | Tragic 5.6% |
| Kiowa | 0.6 /100 | #251 | Tragic 5.7% |
| Hondurans | 0.3 /100 | #252 | Tragic 5.7% |
| Central Americans | 0.3 /100 | #253 | Tragic 5.7% |