Immigrants from Dominica vs Bermudan Unemployment
COMPARE
Immigrants from Dominica
Bermudan
Unemployment
Unemployment Comparison
Immigrants from Dominica
Bermudans
6.7%
UNEMPLOYMENT
0.0/ 100
METRIC RATING
316th/ 347
METRIC RANK
5.6%
UNEMPLOYMENT
1.1/ 100
METRIC RATING
246th/ 347
METRIC RANK
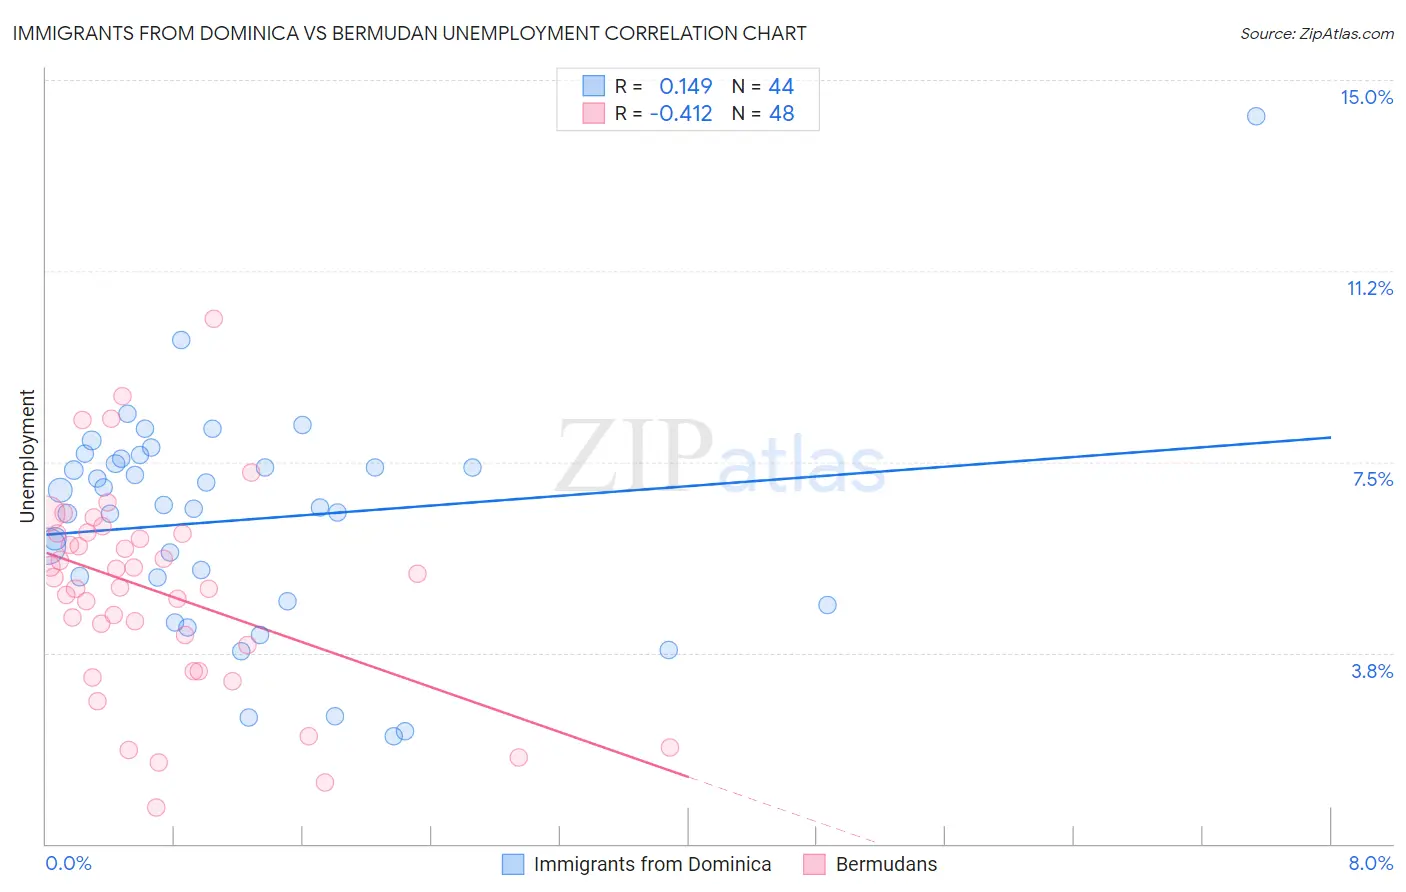
Immigrants from Dominica vs Bermudan Unemployment Correlation Chart
The statistical analysis conducted on geographies consisting of 83,789,741 people shows a poor positive correlation between the proportion of Immigrants from Dominica and unemployment in the United States with a correlation coefficient (R) of 0.149 and weighted average of 6.7%. Similarly, the statistical analysis conducted on geographies consisting of 55,703,293 people shows a moderate negative correlation between the proportion of Bermudans and unemployment in the United States with a correlation coefficient (R) of -0.412 and weighted average of 5.6%, a difference of 20.0%.
Unemployment Correlation Summary
| Measurement | Immigrants from Dominica | Bermudan |
| Minimum | 2.1% | 0.70% |
| Maximum | 14.3% | 10.3% |
| Range | 12.2% | 9.6% |
| Mean | 6.4% | 4.9% |
| Median | 6.6% | 5.1% |
| Interquartile 25% (IQ1) | 5.0% | 3.6% |
| Interquartile 75% (IQ3) | 7.5% | 6.1% |
| Interquartile Range (IQR) | 2.5% | 2.4% |
| Standard Deviation (Sample) | 2.2% | 2.0% |
| Standard Deviation (Population) | 2.2% | 2.0% |
Similar Demographics by Unemployment
Demographics Similar to Immigrants from Dominica by Unemployment
In terms of unemployment, the demographic groups most similar to Immigrants from Dominica are Shoshone (6.8%, a difference of 0.58%), Houma (6.7%, a difference of 0.83%), Immigrants from Cabo Verde (6.8%, a difference of 1.2%), British West Indian (6.8%, a difference of 1.4%), and Black/African American (6.6%, a difference of 1.6%).
| Demographics | Rating | Rank | Unemployment |
| Vietnamese | 0.0 /100 | #309 | Tragic 6.5% |
| Immigrants | Belize | 0.0 /100 | #310 | Tragic 6.5% |
| Cape Verdeans | 0.0 /100 | #311 | Tragic 6.5% |
| Colville | 0.0 /100 | #312 | Tragic 6.6% |
| Immigrants | Barbados | 0.0 /100 | #313 | Tragic 6.6% |
| Blacks/African Americans | 0.0 /100 | #314 | Tragic 6.6% |
| Houma | 0.0 /100 | #315 | Tragic 6.7% |
| Immigrants | Dominica | 0.0 /100 | #316 | Tragic 6.7% |
| Shoshone | 0.0 /100 | #317 | Tragic 6.8% |
| Immigrants | Cabo Verde | 0.0 /100 | #318 | Tragic 6.8% |
| British West Indians | 0.0 /100 | #319 | Tragic 6.8% |
| Immigrants | St. Vincent and the Grenadines | 0.0 /100 | #320 | Tragic 6.9% |
| Immigrants | Guyana | 0.0 /100 | #321 | Tragic 6.9% |
| Guyanese | 0.0 /100 | #322 | Tragic 6.9% |
| Immigrants | Grenada | 0.0 /100 | #323 | Tragic 6.9% |
Demographics Similar to Bermudans by Unemployment
In terms of unemployment, the demographic groups most similar to Bermudans are French American Indian (5.6%, a difference of 0.050%), Dutch West Indian (5.6%, a difference of 0.070%), Immigrants from Cameroon (5.6%, a difference of 0.15%), Marshallese (5.6%, a difference of 0.22%), and Liberian (5.6%, a difference of 0.28%).
| Demographics | Rating | Rank | Unemployment |
| Immigrants | Immigrants | 2.6 /100 | #239 | Tragic 5.5% |
| Cree | 2.6 /100 | #240 | Tragic 5.6% |
| Tlingit-Haida | 2.0 /100 | #241 | Tragic 5.6% |
| Spanish Americans | 2.0 /100 | #242 | Tragic 5.6% |
| Marshallese | 1.3 /100 | #243 | Tragic 5.6% |
| Dutch West Indians | 1.2 /100 | #244 | Tragic 5.6% |
| French American Indians | 1.2 /100 | #245 | Tragic 5.6% |
| Bermudans | 1.1 /100 | #246 | Tragic 5.6% |
| Immigrants | Cameroon | 1.0 /100 | #247 | Tragic 5.6% |
| Liberians | 0.9 /100 | #248 | Tragic 5.6% |
| Cajuns | 0.8 /100 | #249 | Tragic 5.6% |
| Japanese | 0.8 /100 | #250 | Tragic 5.6% |
| Kiowa | 0.6 /100 | #251 | Tragic 5.7% |
| Hondurans | 0.3 /100 | #252 | Tragic 5.7% |
| Central Americans | 0.3 /100 | #253 | Tragic 5.7% |