Creek vs Bermudan Unemployment
COMPARE
Creek
Bermudan
Unemployment
Unemployment Comparison
Creek
Bermudans
5.4%
UNEMPLOYMENT
19.4/ 100
METRIC RATING
207th/ 347
METRIC RANK
5.6%
UNEMPLOYMENT
1.1/ 100
METRIC RATING
246th/ 347
METRIC RANK
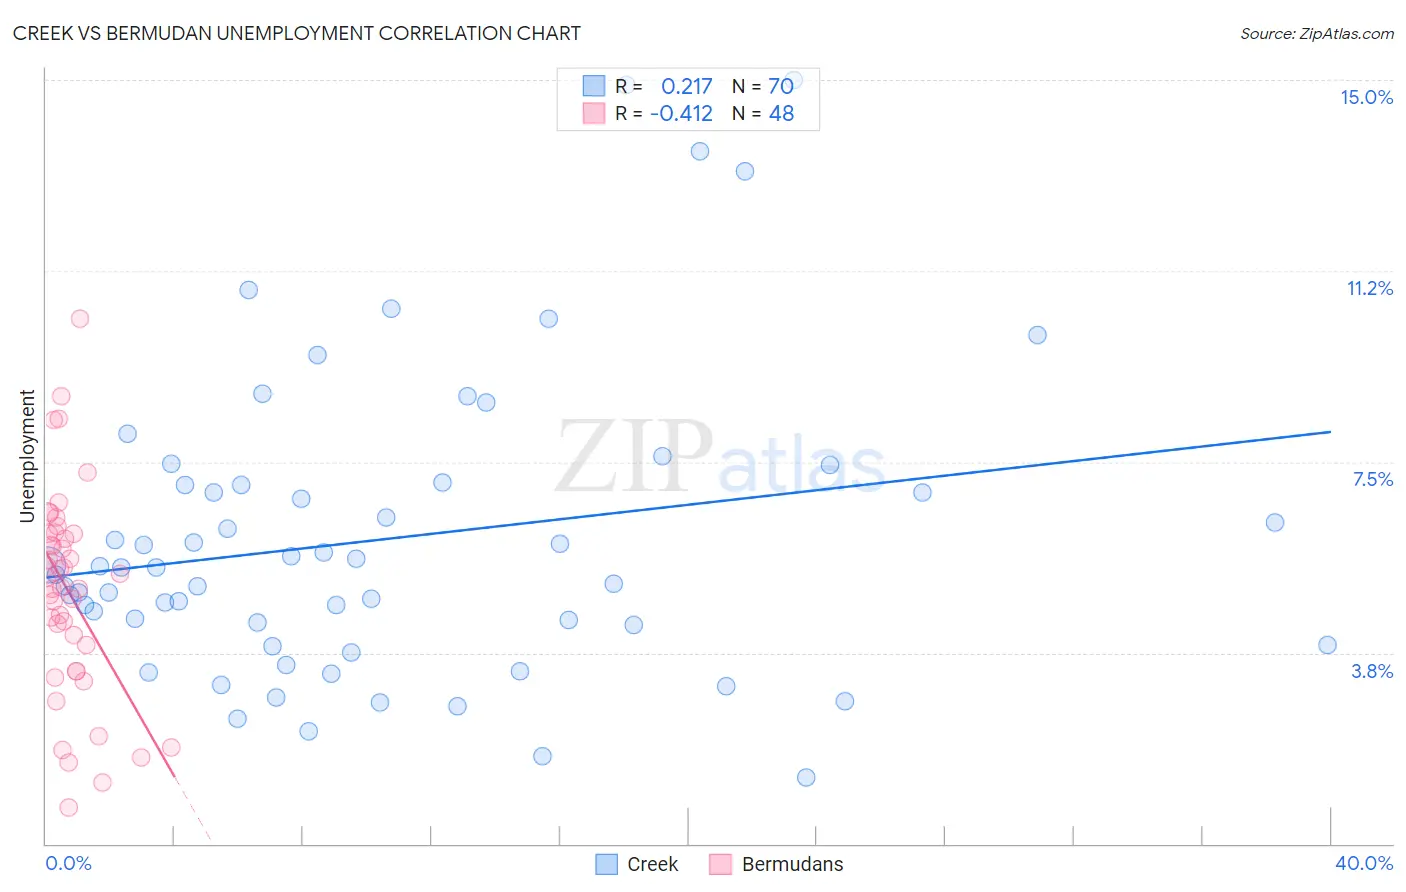
Creek vs Bermudan Unemployment Correlation Chart
The statistical analysis conducted on geographies consisting of 178,280,208 people shows a weak positive correlation between the proportion of Creek and unemployment in the United States with a correlation coefficient (R) of 0.217 and weighted average of 5.4%. Similarly, the statistical analysis conducted on geographies consisting of 55,703,293 people shows a moderate negative correlation between the proportion of Bermudans and unemployment in the United States with a correlation coefficient (R) of -0.412 and weighted average of 5.6%, a difference of 4.6%.
Unemployment Correlation Summary
| Measurement | Creek | Bermudan |
| Minimum | 1.3% | 0.70% |
| Maximum | 15.0% | 10.3% |
| Range | 13.7% | 9.6% |
| Mean | 6.0% | 4.9% |
| Median | 5.4% | 5.1% |
| Interquartile 25% (IQ1) | 4.3% | 3.6% |
| Interquartile 75% (IQ3) | 7.1% | 6.1% |
| Interquartile Range (IQR) | 2.8% | 2.4% |
| Standard Deviation (Sample) | 2.9% | 2.0% |
| Standard Deviation (Population) | 2.9% | 2.0% |
Similar Demographics by Unemployment
Demographics Similar to Creek by Unemployment
In terms of unemployment, the demographic groups most similar to Creek are Portuguese (5.4%, a difference of 0.030%), Immigrants from Iran (5.4%, a difference of 0.060%), Immigrants from Iraq (5.4%, a difference of 0.080%), Iraqi (5.4%, a difference of 0.13%), and Ugandan (5.4%, a difference of 0.14%).
| Demographics | Rating | Rank | Unemployment |
| Koreans | 27.4 /100 | #200 | Fair 5.3% |
| Immigrants | South Eastern Asia | 27.0 /100 | #201 | Fair 5.3% |
| Cherokee | 25.5 /100 | #202 | Fair 5.3% |
| Immigrants | Micronesia | 25.2 /100 | #203 | Fair 5.3% |
| Immigrants | Ukraine | 24.9 /100 | #204 | Fair 5.3% |
| Native Hawaiians | 24.1 /100 | #205 | Fair 5.3% |
| Immigrants | Peru | 22.7 /100 | #206 | Fair 5.4% |
| Creek | 19.4 /100 | #207 | Poor 5.4% |
| Portuguese | 19.0 /100 | #208 | Poor 5.4% |
| Immigrants | Iran | 18.8 /100 | #209 | Poor 5.4% |
| Immigrants | Iraq | 18.6 /100 | #210 | Poor 5.4% |
| Iraqis | 18.1 /100 | #211 | Poor 5.4% |
| Ugandans | 18.0 /100 | #212 | Poor 5.4% |
| Immigrants | Middle Africa | 15.3 /100 | #213 | Poor 5.4% |
| Immigrants | Costa Rica | 15.2 /100 | #214 | Poor 5.4% |
Demographics Similar to Bermudans by Unemployment
In terms of unemployment, the demographic groups most similar to Bermudans are French American Indian (5.6%, a difference of 0.050%), Dutch West Indian (5.6%, a difference of 0.070%), Immigrants from Cameroon (5.6%, a difference of 0.15%), Marshallese (5.6%, a difference of 0.22%), and Liberian (5.6%, a difference of 0.28%).
| Demographics | Rating | Rank | Unemployment |
| Immigrants | Immigrants | 2.6 /100 | #239 | Tragic 5.5% |
| Cree | 2.6 /100 | #240 | Tragic 5.6% |
| Tlingit-Haida | 2.0 /100 | #241 | Tragic 5.6% |
| Spanish Americans | 2.0 /100 | #242 | Tragic 5.6% |
| Marshallese | 1.3 /100 | #243 | Tragic 5.6% |
| Dutch West Indians | 1.2 /100 | #244 | Tragic 5.6% |
| French American Indians | 1.2 /100 | #245 | Tragic 5.6% |
| Bermudans | 1.1 /100 | #246 | Tragic 5.6% |
| Immigrants | Cameroon | 1.0 /100 | #247 | Tragic 5.6% |
| Liberians | 0.9 /100 | #248 | Tragic 5.6% |
| Cajuns | 0.8 /100 | #249 | Tragic 5.6% |
| Japanese | 0.8 /100 | #250 | Tragic 5.6% |
| Kiowa | 0.6 /100 | #251 | Tragic 5.7% |
| Hondurans | 0.3 /100 | #252 | Tragic 5.7% |
| Central Americans | 0.3 /100 | #253 | Tragic 5.7% |