Filipino vs Thai Unemployment
COMPARE
Filipino
Thai
Unemployment
Unemployment Comparison
Filipinos
Thais
4.8%
UNEMPLOYMENT
99.5/ 100
METRIC RATING
42nd/ 347
METRIC RANK
4.7%
UNEMPLOYMENT
99.9/ 100
METRIC RATING
22nd/ 347
METRIC RANK
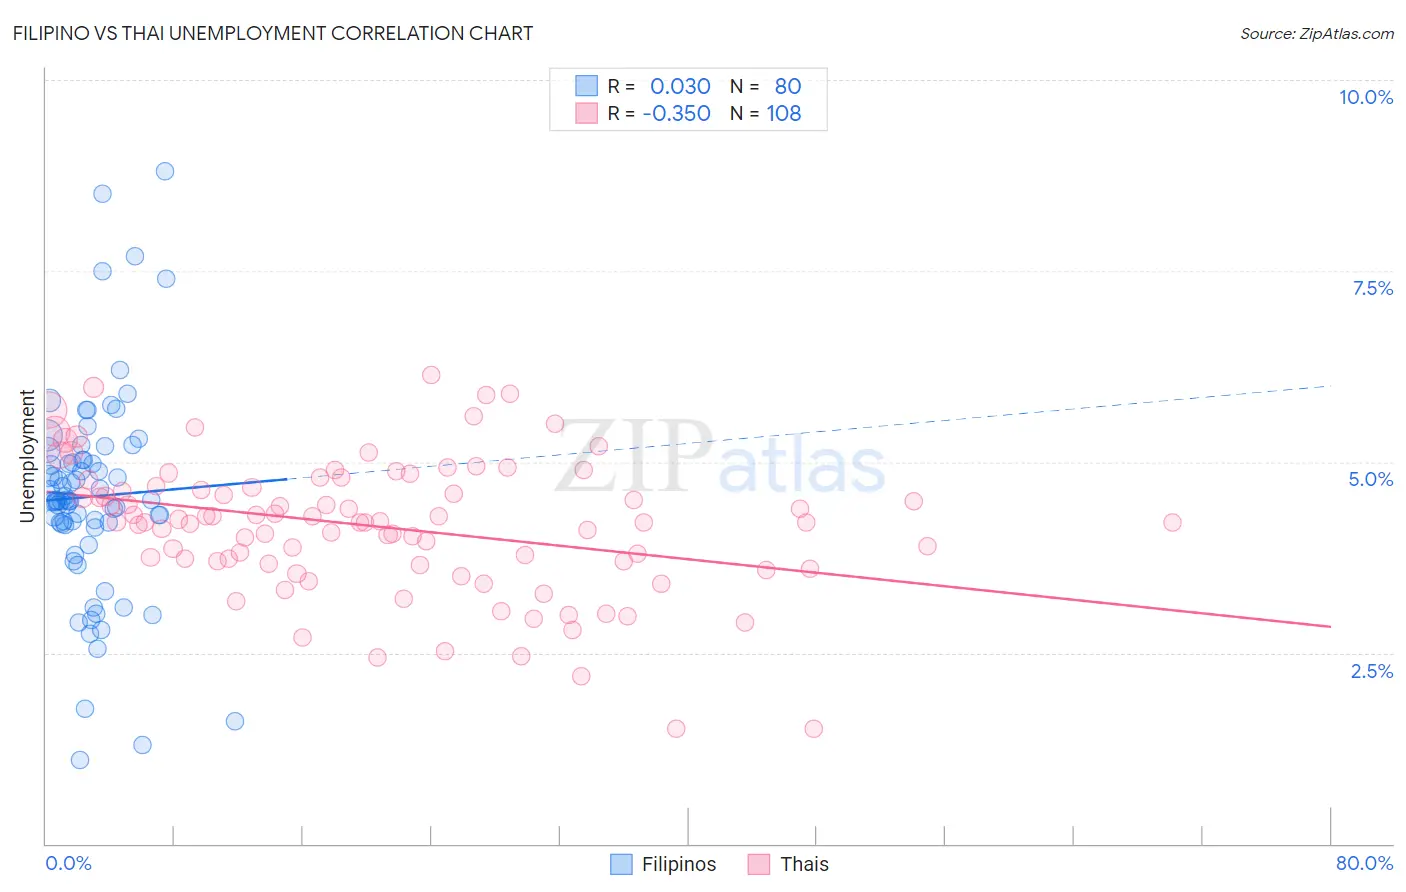
Filipino vs Thai Unemployment Correlation Chart
The statistical analysis conducted on geographies consisting of 254,275,542 people shows no correlation between the proportion of Filipinos and unemployment in the United States with a correlation coefficient (R) of 0.030 and weighted average of 4.8%. Similarly, the statistical analysis conducted on geographies consisting of 475,133,267 people shows a mild negative correlation between the proportion of Thais and unemployment in the United States with a correlation coefficient (R) of -0.350 and weighted average of 4.7%, a difference of 2.8%.
Unemployment Correlation Summary
| Measurement | Filipino | Thai |
| Minimum | 1.1% | 1.5% |
| Maximum | 8.8% | 6.1% |
| Range | 7.7% | 4.6% |
| Mean | 4.5% | 4.2% |
| Median | 4.5% | 4.2% |
| Interquartile 25% (IQ1) | 4.2% | 3.7% |
| Interquartile 75% (IQ3) | 5.0% | 4.7% |
| Interquartile Range (IQR) | 0.84% | 0.99% |
| Standard Deviation (Sample) | 1.4% | 0.89% |
| Standard Deviation (Population) | 1.4% | 0.88% |
Demographics Similar to Filipinos and Thais by Unemployment
In terms of unemployment, the demographic groups most similar to Filipinos are Immigrants from Bosnia and Herzegovina (4.8%, a difference of 0.48%), Northern European (4.8%, a difference of 0.50%), Lithuanian (4.8%, a difference of 0.52%), Bolivian (4.8%, a difference of 0.67%), and Czechoslovakian (4.8%, a difference of 0.86%). Similarly, the demographic groups most similar to Thais are British (4.7%, a difference of 0.30%), Venezuelan (4.7%, a difference of 0.38%), Latvian (4.7%, a difference of 0.45%), Bulgarian (4.7%, a difference of 0.49%), and Finnish (4.7%, a difference of 0.70%).
| Demographics | Rating | Rank | Unemployment |
| Thais | 99.9 /100 | #22 | Exceptional 4.7% |
| British | 99.9 /100 | #23 | Exceptional 4.7% |
| Venezuelans | 99.9 /100 | #24 | Exceptional 4.7% |
| Latvians | 99.9 /100 | #25 | Exceptional 4.7% |
| Bulgarians | 99.9 /100 | #26 | Exceptional 4.7% |
| Finns | 99.9 /100 | #27 | Exceptional 4.7% |
| Cubans | 99.8 /100 | #28 | Exceptional 4.7% |
| Poles | 99.8 /100 | #29 | Exceptional 4.7% |
| Irish | 99.8 /100 | #30 | Exceptional 4.8% |
| Croatians | 99.8 /100 | #31 | Exceptional 4.8% |
| Zimbabweans | 99.8 /100 | #32 | Exceptional 4.8% |
| Sudanese | 99.8 /100 | #33 | Exceptional 4.8% |
| Immigrants | Bolivia | 99.8 /100 | #34 | Exceptional 4.8% |
| Scotch-Irish | 99.8 /100 | #35 | Exceptional 4.8% |
| Tongans | 99.7 /100 | #36 | Exceptional 4.8% |
| Czechoslovakians | 99.7 /100 | #37 | Exceptional 4.8% |
| Bolivians | 99.7 /100 | #38 | Exceptional 4.8% |
| Lithuanians | 99.7 /100 | #39 | Exceptional 4.8% |
| Northern Europeans | 99.7 /100 | #40 | Exceptional 4.8% |
| Immigrants | Bosnia and Herzegovina | 99.7 /100 | #41 | Exceptional 4.8% |
| Filipinos | 99.5 /100 | #42 | Exceptional 4.8% |