Immigrants from Belize vs Thai Unemployment
COMPARE
Immigrants from Belize
Thai
Unemployment
Unemployment Comparison
Immigrants from Belize
Thais
6.5%
UNEMPLOYMENT
0.0/ 100
METRIC RATING
310th/ 347
METRIC RANK
4.7%
UNEMPLOYMENT
99.9/ 100
METRIC RATING
22nd/ 347
METRIC RANK
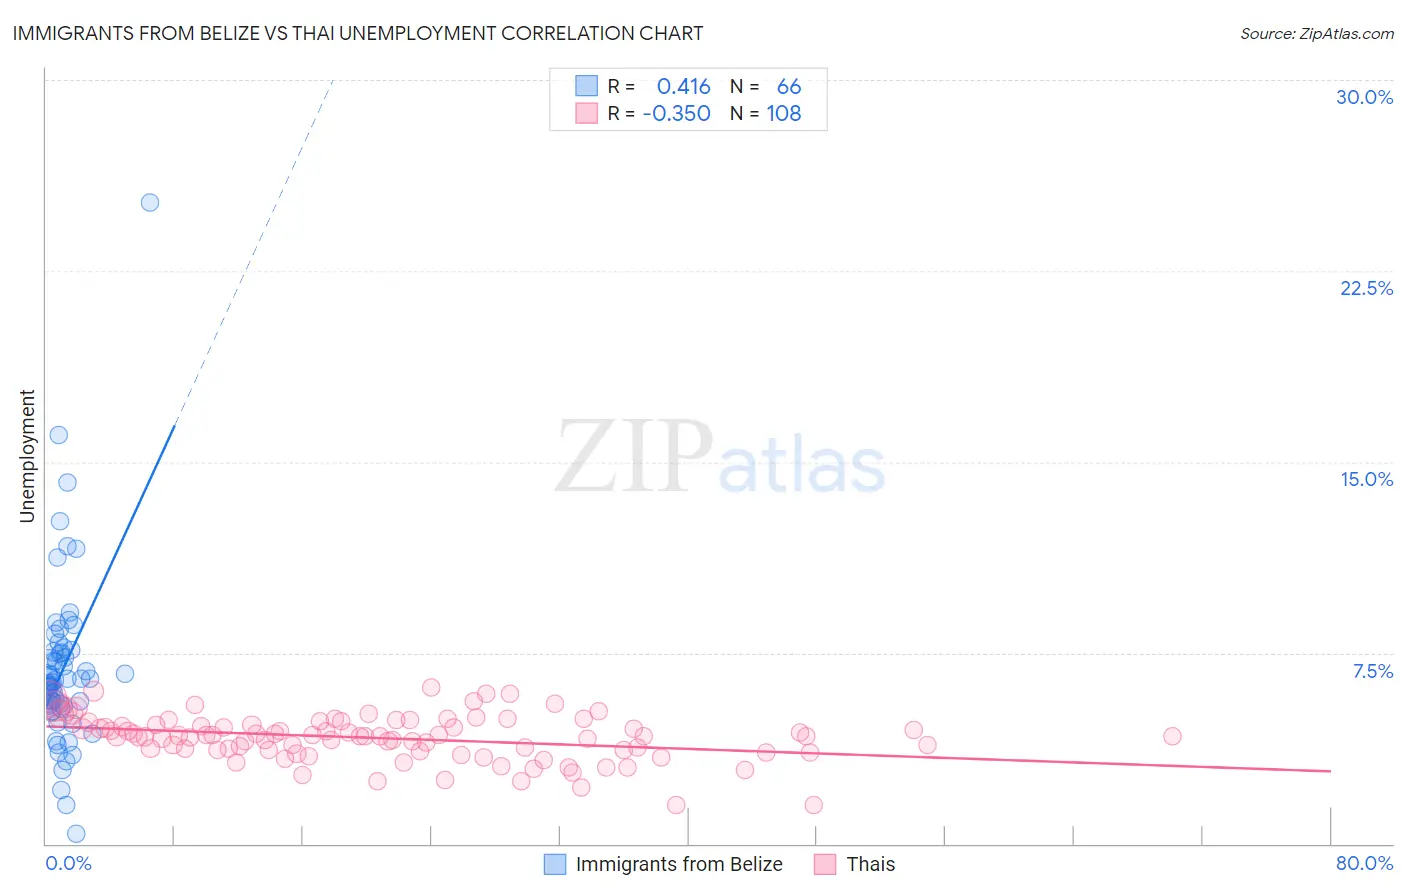
Immigrants from Belize vs Thai Unemployment Correlation Chart
The statistical analysis conducted on geographies consisting of 130,280,852 people shows a moderate positive correlation between the proportion of Immigrants from Belize and unemployment in the United States with a correlation coefficient (R) of 0.416 and weighted average of 6.5%. Similarly, the statistical analysis conducted on geographies consisting of 475,133,267 people shows a mild negative correlation between the proportion of Thais and unemployment in the United States with a correlation coefficient (R) of -0.350 and weighted average of 4.7%, a difference of 38.8%.
Unemployment Correlation Summary
| Measurement | Immigrants from Belize | Thai |
| Minimum | 0.40% | 1.5% |
| Maximum | 25.2% | 6.1% |
| Range | 24.8% | 4.6% |
| Mean | 6.9% | 4.2% |
| Median | 6.4% | 4.2% |
| Interquartile 25% (IQ1) | 5.4% | 3.7% |
| Interquartile 75% (IQ3) | 7.5% | 4.7% |
| Interquartile Range (IQR) | 2.2% | 0.99% |
| Standard Deviation (Sample) | 3.5% | 0.89% |
| Standard Deviation (Population) | 3.5% | 0.88% |
Similar Demographics by Unemployment
Demographics Similar to Immigrants from Belize by Unemployment
In terms of unemployment, the demographic groups most similar to Immigrants from Belize are Vietnamese (6.5%, a difference of 0.27%), Barbadian (6.5%, a difference of 0.28%), Cape Verdean (6.5%, a difference of 0.33%), Immigrants from Bangladesh (6.5%, a difference of 0.65%), and Colville (6.6%, a difference of 0.91%).
| Demographics | Rating | Rank | Unemployment |
| Belizeans | 0.0 /100 | #303 | Tragic 6.4% |
| Immigrants | Jamaica | 0.0 /100 | #304 | Tragic 6.4% |
| Menominee | 0.0 /100 | #305 | Tragic 6.4% |
| Lumbee | 0.0 /100 | #306 | Tragic 6.4% |
| Immigrants | Bangladesh | 0.0 /100 | #307 | Tragic 6.5% |
| Barbadians | 0.0 /100 | #308 | Tragic 6.5% |
| Vietnamese | 0.0 /100 | #309 | Tragic 6.5% |
| Immigrants | Belize | 0.0 /100 | #310 | Tragic 6.5% |
| Cape Verdeans | 0.0 /100 | #311 | Tragic 6.5% |
| Colville | 0.0 /100 | #312 | Tragic 6.6% |
| Immigrants | Barbados | 0.0 /100 | #313 | Tragic 6.6% |
| Blacks/African Americans | 0.0 /100 | #314 | Tragic 6.6% |
| Houma | 0.0 /100 | #315 | Tragic 6.7% |
| Immigrants | Dominica | 0.0 /100 | #316 | Tragic 6.7% |
| Shoshone | 0.0 /100 | #317 | Tragic 6.8% |
Demographics Similar to Thais by Unemployment
In terms of unemployment, the demographic groups most similar to Thais are Welsh (4.7%, a difference of 0.0%), Carpatho Rusyn (4.7%, a difference of 0.020%), British (4.7%, a difference of 0.30%), Venezuelan (4.7%, a difference of 0.38%), and Latvian (4.7%, a difference of 0.45%).
| Demographics | Rating | Rank | Unemployment |
| Europeans | 99.9 /100 | #15 | Exceptional 4.6% |
| Chinese | 99.9 /100 | #16 | Exceptional 4.7% |
| Slovenes | 99.9 /100 | #17 | Exceptional 4.7% |
| Immigrants | Venezuela | 99.9 /100 | #18 | Exceptional 4.7% |
| Scottish | 99.9 /100 | #19 | Exceptional 4.7% |
| Carpatho Rusyns | 99.9 /100 | #20 | Exceptional 4.7% |
| Welsh | 99.9 /100 | #21 | Exceptional 4.7% |
| Thais | 99.9 /100 | #22 | Exceptional 4.7% |
| British | 99.9 /100 | #23 | Exceptional 4.7% |
| Venezuelans | 99.9 /100 | #24 | Exceptional 4.7% |
| Latvians | 99.9 /100 | #25 | Exceptional 4.7% |
| Bulgarians | 99.9 /100 | #26 | Exceptional 4.7% |
| Finns | 99.9 /100 | #27 | Exceptional 4.7% |
| Cubans | 99.8 /100 | #28 | Exceptional 4.7% |
| Poles | 99.8 /100 | #29 | Exceptional 4.7% |