Filipino vs Crow Unemployment
COMPARE
Filipino
Crow
Unemployment
Unemployment Comparison
Filipinos
Crow
4.8%
UNEMPLOYMENT
99.5/ 100
METRIC RATING
42nd/ 347
METRIC RANK
11.1%
UNEMPLOYMENT
0.0/ 100
METRIC RATING
346th/ 347
METRIC RANK
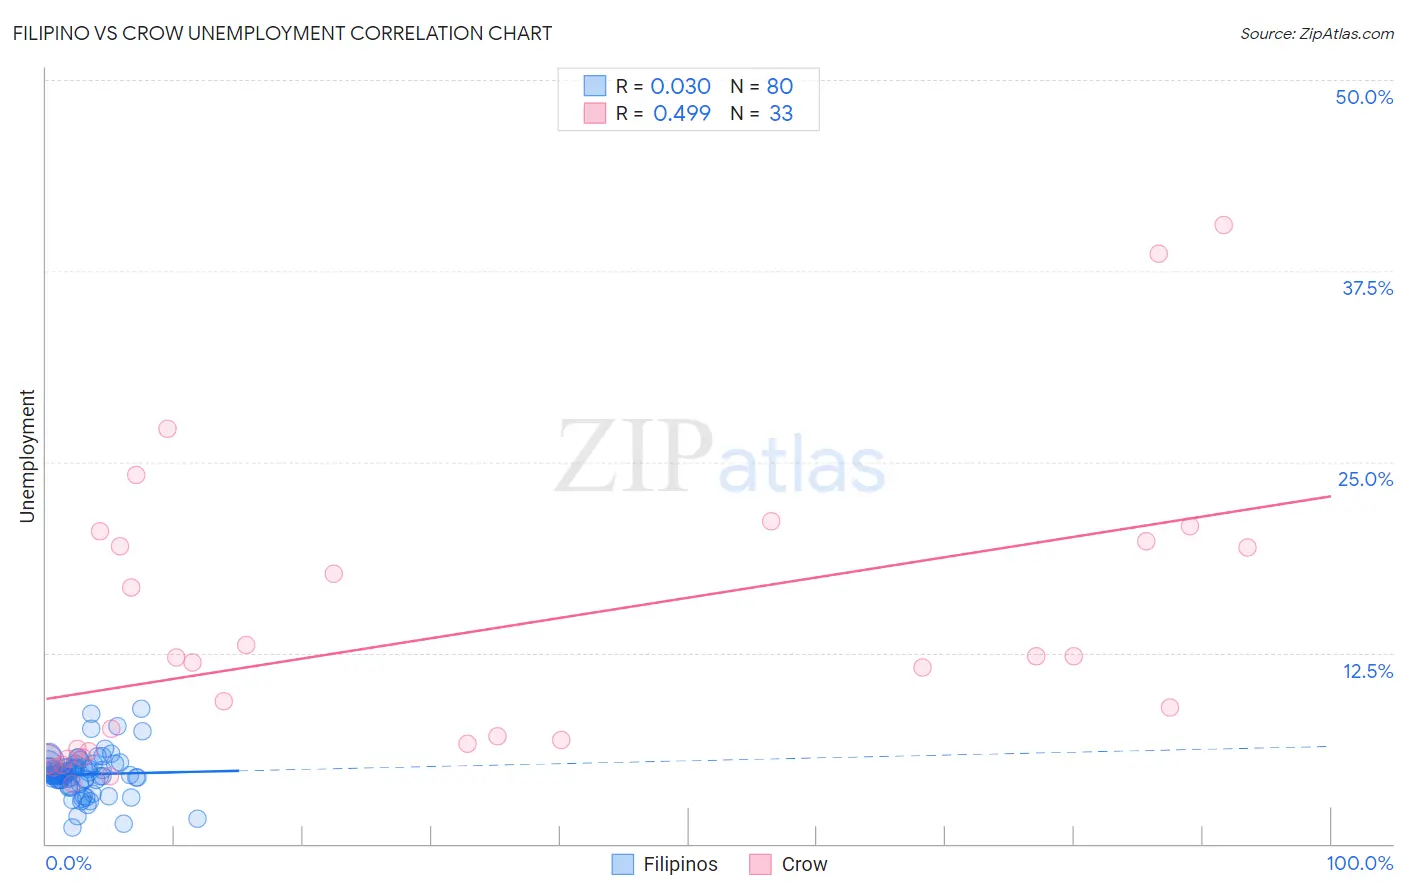
Filipino vs Crow Unemployment Correlation Chart
The statistical analysis conducted on geographies consisting of 254,275,542 people shows no correlation between the proportion of Filipinos and unemployment in the United States with a correlation coefficient (R) of 0.030 and weighted average of 4.8%. Similarly, the statistical analysis conducted on geographies consisting of 59,183,327 people shows a moderate positive correlation between the proportion of Crow and unemployment in the United States with a correlation coefficient (R) of 0.499 and weighted average of 11.1%, a difference of 129.4%.
Unemployment Correlation Summary
| Measurement | Filipino | Crow |
| Minimum | 1.1% | 3.9% |
| Maximum | 8.8% | 40.5% |
| Range | 7.7% | 36.6% |
| Mean | 4.5% | 13.7% |
| Median | 4.5% | 11.9% |
| Interquartile 25% (IQ1) | 4.2% | 6.1% |
| Interquartile 75% (IQ3) | 5.0% | 19.6% |
| Interquartile Range (IQR) | 0.84% | 13.5% |
| Standard Deviation (Sample) | 1.4% | 9.3% |
| Standard Deviation (Population) | 1.4% | 9.2% |
Similar Demographics by Unemployment
Demographics Similar to Filipinos by Unemployment
In terms of unemployment, the demographic groups most similar to Filipinos are Yugoslavian (4.8%, a difference of 0.20%), Austrian (4.8%, a difference of 0.26%), French (4.8%, a difference of 0.31%), Immigrants from Bosnia and Herzegovina (4.8%, a difference of 0.48%), and Immigrants from Nepal (4.8%, a difference of 0.48%).
| Demographics | Rating | Rank | Unemployment |
| Scotch-Irish | 99.8 /100 | #35 | Exceptional 4.8% |
| Tongans | 99.7 /100 | #36 | Exceptional 4.8% |
| Czechoslovakians | 99.7 /100 | #37 | Exceptional 4.8% |
| Bolivians | 99.7 /100 | #38 | Exceptional 4.8% |
| Lithuanians | 99.7 /100 | #39 | Exceptional 4.8% |
| Northern Europeans | 99.7 /100 | #40 | Exceptional 4.8% |
| Immigrants | Bosnia and Herzegovina | 99.7 /100 | #41 | Exceptional 4.8% |
| Filipinos | 99.5 /100 | #42 | Exceptional 4.8% |
| Yugoslavians | 99.5 /100 | #43 | Exceptional 4.8% |
| Austrians | 99.5 /100 | #44 | Exceptional 4.8% |
| French | 99.5 /100 | #45 | Exceptional 4.8% |
| Immigrants | Nepal | 99.4 /100 | #46 | Exceptional 4.8% |
| Immigrants | Taiwan | 99.4 /100 | #47 | Exceptional 4.8% |
| Immigrants | Scotland | 99.3 /100 | #48 | Exceptional 4.9% |
| Immigrants | South Central Asia | 99.3 /100 | #49 | Exceptional 4.9% |
Demographics Similar to Crow by Unemployment
In terms of unemployment, the demographic groups most similar to Crow are Inupiat (10.1%, a difference of 9.4%), Arapaho (9.8%, a difference of 12.6%), Yuman (9.1%, a difference of 22.0%), Yup'ik (13.6%, a difference of 23.3%), and Hopi (8.9%, a difference of 24.1%).
| Demographics | Rating | Rank | Unemployment |
| Immigrants | Dominican Republic | 0.0 /100 | #333 | Tragic 7.4% |
| Apache | 0.0 /100 | #334 | Tragic 7.4% |
| Alaskan Athabascans | 0.0 /100 | #335 | Tragic 7.7% |
| Immigrants | Yemen | 0.0 /100 | #336 | Tragic 7.7% |
| Cheyenne | 0.0 /100 | #337 | Tragic 8.0% |
| Pima | 0.0 /100 | #338 | Tragic 8.2% |
| Navajo | 0.0 /100 | #339 | Tragic 8.4% |
| Puerto Ricans | 0.0 /100 | #340 | Tragic 8.4% |
| Tohono O'odham | 0.0 /100 | #341 | Tragic 8.9% |
| Hopi | 0.0 /100 | #342 | Tragic 8.9% |
| Yuman | 0.0 /100 | #343 | Tragic 9.1% |
| Arapaho | 0.0 /100 | #344 | Tragic 9.8% |
| Inupiat | 0.0 /100 | #345 | Tragic 10.1% |
| Crow | 0.0 /100 | #346 | Tragic 11.1% |
| Yup'ik | 0.0 /100 | #347 | Tragic 13.6% |