Filipino vs Immigrants from Middle Africa Unemployment Among Women with Children Under 6 years
COMPARE
Filipino
Immigrants from Middle Africa
Unemployment Among Women with Children Under 6 years
Unemployment Among Women with Children Under 6 years Comparison
Filipinos
Immigrants from Middle Africa
6.1%
UNEMPLOYMENT AMONG WOMEN WITH CHILDREN UNDER 6 YEARS
100.0/ 100
METRIC RATING
9th/ 347
METRIC RANK
8.1%
UNEMPLOYMENT AMONG WOMEN WITH CHILDREN UNDER 6 YEARS
3.2/ 100
METRIC RATING
238th/ 347
METRIC RANK
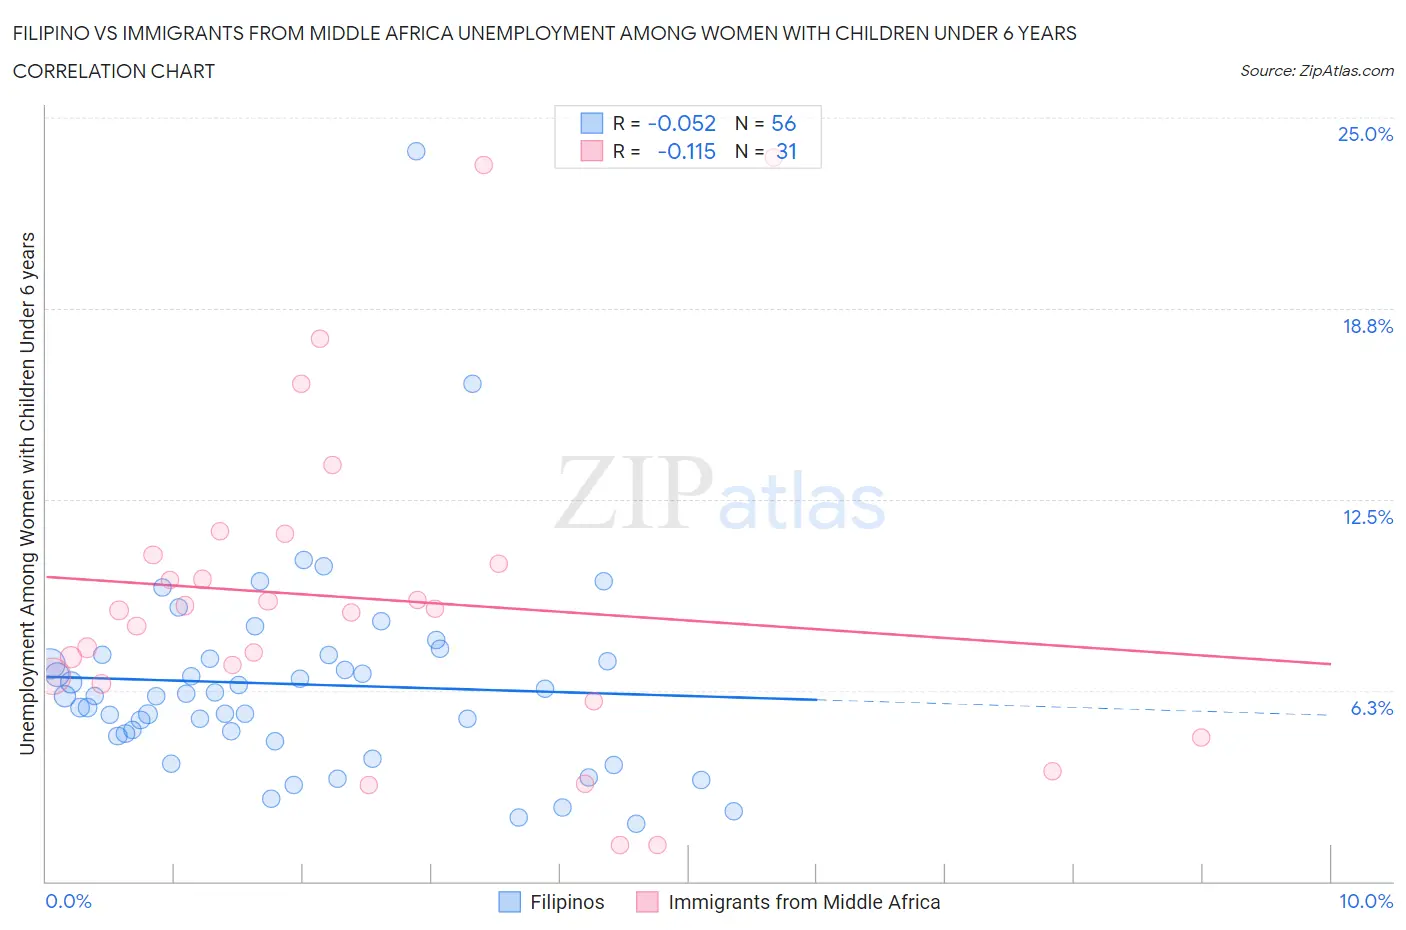
Filipino vs Immigrants from Middle Africa Unemployment Among Women with Children Under 6 years Correlation Chart
The statistical analysis conducted on geographies consisting of 208,639,932 people shows a slight negative correlation between the proportion of Filipinos and unemployment rate among women with children under the age of 6 in the United States with a correlation coefficient (R) of -0.052 and weighted average of 6.1%. Similarly, the statistical analysis conducted on geographies consisting of 174,129,254 people shows a poor negative correlation between the proportion of Immigrants from Middle Africa and unemployment rate among women with children under the age of 6 in the United States with a correlation coefficient (R) of -0.115 and weighted average of 8.1%, a difference of 31.6%.
Unemployment Among Women with Children Under 6 years Correlation Summary
| Measurement | Filipino | Immigrants from Middle Africa |
| Minimum | 1.9% | 1.2% |
| Maximum | 23.9% | 23.7% |
| Range | 22.0% | 22.5% |
| Mean | 6.4% | 9.2% |
| Median | 6.1% | 8.9% |
| Interquartile 25% (IQ1) | 4.8% | 6.5% |
| Interquartile 75% (IQ3) | 7.4% | 10.7% |
| Interquartile Range (IQR) | 2.6% | 4.2% |
| Standard Deviation (Sample) | 3.5% | 5.4% |
| Standard Deviation (Population) | 3.4% | 5.3% |
Similar Demographics by Unemployment Among Women with Children Under 6 years
Demographics Similar to Filipinos by Unemployment Among Women with Children Under 6 years
In terms of unemployment among women with children under 6 years, the demographic groups most similar to Filipinos are Immigrants from India (6.1%, a difference of 0.45%), Taiwanese (6.1%, a difference of 0.94%), Immigrants from Taiwan (6.0%, a difference of 1.5%), Immigrants from China (6.2%, a difference of 1.5%), and Indian (Asian) (6.3%, a difference of 2.6%).
| Demographics | Rating | Rank | Unemployment Among Women with Children Under 6 years |
| Immigrants | Hong Kong | 100.0 /100 | #2 | Exceptional 5.8% |
| Okinawans | 100.0 /100 | #3 | Exceptional 5.8% |
| Cambodians | 100.0 /100 | #4 | Exceptional 5.9% |
| Cape Verdeans | 100.0 /100 | #5 | Exceptional 5.9% |
| Immigrants | Taiwan | 100.0 /100 | #6 | Exceptional 6.0% |
| Taiwanese | 100.0 /100 | #7 | Exceptional 6.1% |
| Immigrants | India | 100.0 /100 | #8 | Exceptional 6.1% |
| Filipinos | 100.0 /100 | #9 | Exceptional 6.1% |
| Immigrants | China | 100.0 /100 | #10 | Exceptional 6.2% |
| Indians (Asian) | 100.0 /100 | #11 | Exceptional 6.3% |
| Immigrants | Singapore | 100.0 /100 | #12 | Exceptional 6.3% |
| Immigrants | Eastern Asia | 100.0 /100 | #13 | Exceptional 6.3% |
| Immigrants | Bulgaria | 100.0 /100 | #14 | Exceptional 6.3% |
| Thais | 100.0 /100 | #15 | Exceptional 6.3% |
| Immigrants | Uzbekistan | 100.0 /100 | #16 | Exceptional 6.3% |
Demographics Similar to Immigrants from Middle Africa by Unemployment Among Women with Children Under 6 years
In terms of unemployment among women with children under 6 years, the demographic groups most similar to Immigrants from Middle Africa are Irish (8.1%, a difference of 0.26%), Immigrants from El Salvador (8.1%, a difference of 0.34%), Liberian (8.1%, a difference of 0.36%), Immigrants from Costa Rica (8.0%, a difference of 0.38%), and Dutch (8.1%, a difference of 0.42%).
| Demographics | Rating | Rank | Unemployment Among Women with Children Under 6 years |
| Trinidadians and Tobagonians | 5.3 /100 | #231 | Tragic 8.0% |
| Welsh | 5.0 /100 | #232 | Tragic 8.0% |
| Immigrants | Trinidad and Tobago | 4.8 /100 | #233 | Tragic 8.0% |
| Kiowa | 4.4 /100 | #234 | Tragic 8.0% |
| Comanche | 4.3 /100 | #235 | Tragic 8.0% |
| Immigrants | Barbados | 4.2 /100 | #236 | Tragic 8.0% |
| Immigrants | Costa Rica | 4.1 /100 | #237 | Tragic 8.0% |
| Immigrants | Middle Africa | 3.2 /100 | #238 | Tragic 8.1% |
| Irish | 2.7 /100 | #239 | Tragic 8.1% |
| Immigrants | El Salvador | 2.6 /100 | #240 | Tragic 8.1% |
| Liberians | 2.6 /100 | #241 | Tragic 8.1% |
| Dutch | 2.5 /100 | #242 | Tragic 8.1% |
| Hawaiians | 1.8 /100 | #243 | Tragic 8.2% |
| French | 1.7 /100 | #244 | Tragic 8.2% |
| Native Hawaiians | 1.7 /100 | #245 | Tragic 8.2% |