Immigrants from Guatemala vs Immigrants from Middle Africa Unemployment Among Women with Children Under 6 years
COMPARE
Immigrants from Guatemala
Immigrants from Middle Africa
Unemployment Among Women with Children Under 6 years
Unemployment Among Women with Children Under 6 years Comparison
Immigrants from Guatemala
Immigrants from Middle Africa
8.6%
UNEMPLOYMENT AMONG WOMEN WITH CHILDREN UNDER 6 YEARS
0.0/ 100
METRIC RATING
279th/ 347
METRIC RANK
8.1%
UNEMPLOYMENT AMONG WOMEN WITH CHILDREN UNDER 6 YEARS
3.2/ 100
METRIC RATING
238th/ 347
METRIC RANK
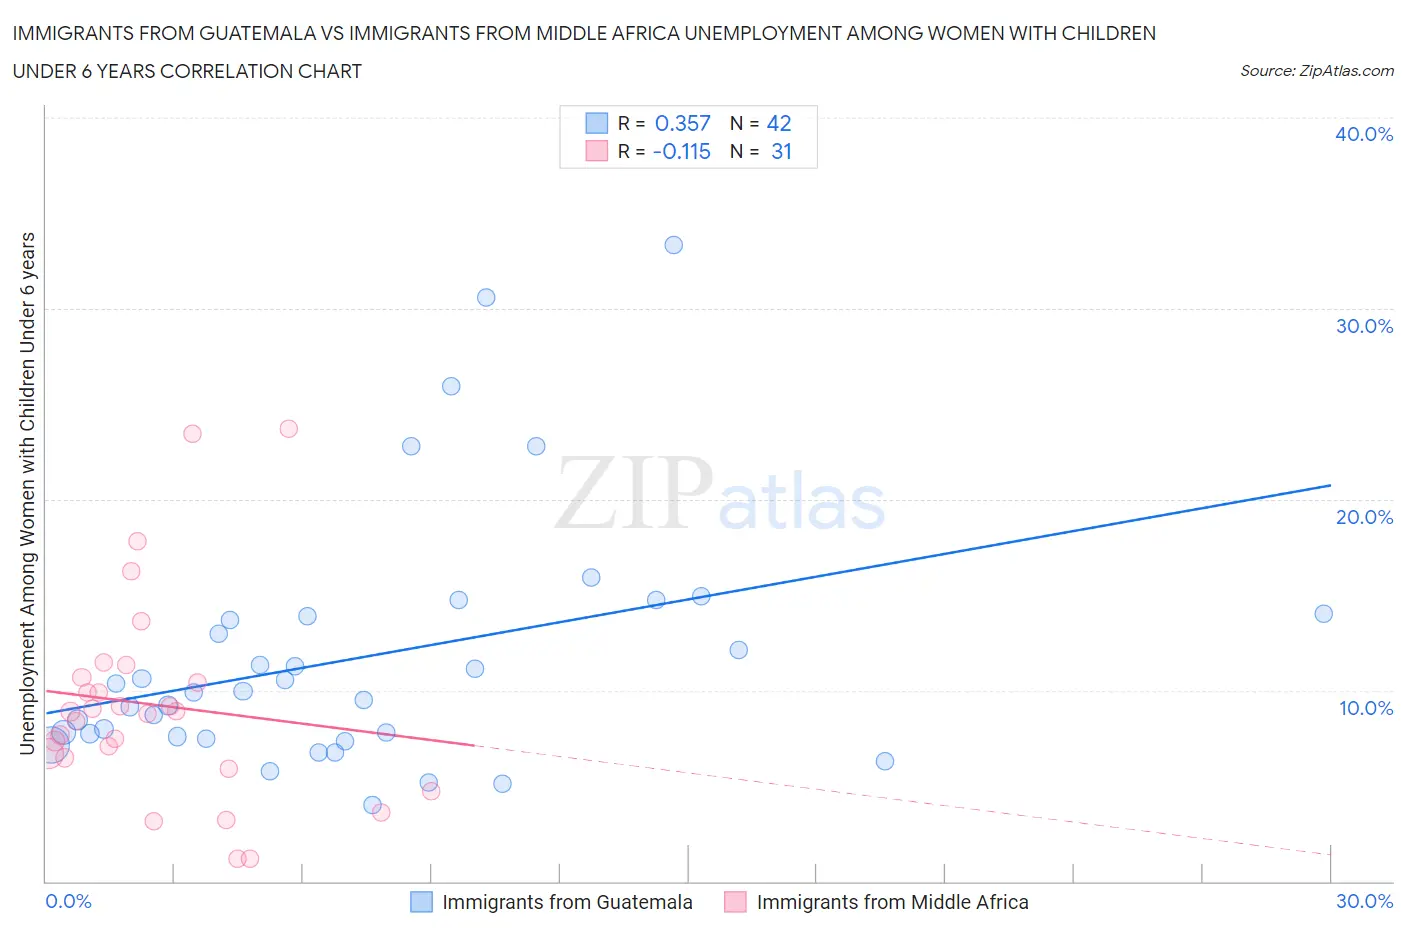
Immigrants from Guatemala vs Immigrants from Middle Africa Unemployment Among Women with Children Under 6 years Correlation Chart
The statistical analysis conducted on geographies consisting of 295,209,480 people shows a mild positive correlation between the proportion of Immigrants from Guatemala and unemployment rate among women with children under the age of 6 in the United States with a correlation coefficient (R) of 0.357 and weighted average of 8.6%. Similarly, the statistical analysis conducted on geographies consisting of 174,129,254 people shows a poor negative correlation between the proportion of Immigrants from Middle Africa and unemployment rate among women with children under the age of 6 in the United States with a correlation coefficient (R) of -0.115 and weighted average of 8.1%, a difference of 7.0%.
Unemployment Among Women with Children Under 6 years Correlation Summary
| Measurement | Immigrants from Guatemala | Immigrants from Middle Africa |
| Minimum | 4.0% | 1.2% |
| Maximum | 33.3% | 23.7% |
| Range | 29.3% | 22.5% |
| Mean | 11.7% | 9.2% |
| Median | 9.9% | 8.9% |
| Interquartile 25% (IQ1) | 7.6% | 6.5% |
| Interquartile 75% (IQ3) | 13.9% | 10.7% |
| Interquartile Range (IQR) | 6.3% | 4.2% |
| Standard Deviation (Sample) | 6.6% | 5.4% |
| Standard Deviation (Population) | 6.5% | 5.3% |
Similar Demographics by Unemployment Among Women with Children Under 6 years
Demographics Similar to Immigrants from Guatemala by Unemployment Among Women with Children Under 6 years
In terms of unemployment among women with children under 6 years, the demographic groups most similar to Immigrants from Guatemala are Immigrants from Dominica (8.6%, a difference of 0.010%), Immigrants from Belize (8.6%, a difference of 0.040%), Guatemalan (8.7%, a difference of 0.18%), Bermudan (8.7%, a difference of 0.27%), and Haitian (8.6%, a difference of 0.29%).
| Demographics | Rating | Rank | Unemployment Among Women with Children Under 6 years |
| Mexican American Indians | 0.1 /100 | #272 | Tragic 8.5% |
| Slovaks | 0.1 /100 | #273 | Tragic 8.5% |
| Immigrants | Cameroon | 0.1 /100 | #274 | Tragic 8.6% |
| Immigrants | Latin America | 0.1 /100 | #275 | Tragic 8.6% |
| Yaqui | 0.0 /100 | #276 | Tragic 8.6% |
| Haitians | 0.0 /100 | #277 | Tragic 8.6% |
| Immigrants | Dominica | 0.0 /100 | #278 | Tragic 8.6% |
| Immigrants | Guatemala | 0.0 /100 | #279 | Tragic 8.6% |
| Immigrants | Belize | 0.0 /100 | #280 | Tragic 8.6% |
| Guatemalans | 0.0 /100 | #281 | Tragic 8.7% |
| Bermudans | 0.0 /100 | #282 | Tragic 8.7% |
| Spanish American Indians | 0.0 /100 | #283 | Tragic 8.7% |
| Blackfeet | 0.0 /100 | #284 | Tragic 8.7% |
| U.S. Virgin Islanders | 0.0 /100 | #285 | Tragic 8.7% |
| Seminole | 0.0 /100 | #286 | Tragic 8.7% |
Demographics Similar to Immigrants from Middle Africa by Unemployment Among Women with Children Under 6 years
In terms of unemployment among women with children under 6 years, the demographic groups most similar to Immigrants from Middle Africa are Irish (8.1%, a difference of 0.26%), Immigrants from El Salvador (8.1%, a difference of 0.34%), Liberian (8.1%, a difference of 0.36%), Immigrants from Costa Rica (8.0%, a difference of 0.38%), and Dutch (8.1%, a difference of 0.42%).
| Demographics | Rating | Rank | Unemployment Among Women with Children Under 6 years |
| Trinidadians and Tobagonians | 5.3 /100 | #231 | Tragic 8.0% |
| Welsh | 5.0 /100 | #232 | Tragic 8.0% |
| Immigrants | Trinidad and Tobago | 4.8 /100 | #233 | Tragic 8.0% |
| Kiowa | 4.4 /100 | #234 | Tragic 8.0% |
| Comanche | 4.3 /100 | #235 | Tragic 8.0% |
| Immigrants | Barbados | 4.2 /100 | #236 | Tragic 8.0% |
| Immigrants | Costa Rica | 4.1 /100 | #237 | Tragic 8.0% |
| Immigrants | Middle Africa | 3.2 /100 | #238 | Tragic 8.1% |
| Irish | 2.7 /100 | #239 | Tragic 8.1% |
| Immigrants | El Salvador | 2.6 /100 | #240 | Tragic 8.1% |
| Liberians | 2.6 /100 | #241 | Tragic 8.1% |
| Dutch | 2.5 /100 | #242 | Tragic 8.1% |
| Hawaiians | 1.8 /100 | #243 | Tragic 8.2% |
| French | 1.7 /100 | #244 | Tragic 8.2% |
| Native Hawaiians | 1.7 /100 | #245 | Tragic 8.2% |