Filipino vs Senegalese Unemployment Among Women with Children Under 6 years

COMPARE

Filipino
Race
Ancestry
AfghanAfricanAlaska NativeAlaskan AthabascanAlbanianAleutAlsatianAmericanApacheArabArapahoArgentineanArmenianAssyrian/Chaldean/SyriacAustralianAustrianBahamianBangladeshiBarbadianBasqueBelgianBelizeanBermudanBhutaneseBlackfeetBolivianBrazilianBritishBritish West IndianBulgarianBurmeseCajunCambodianCanadianCape VerdeanCarpatho RusynCelticCentral AmericanCentral American IndianCherokeeCheyenneChickasawChileanChineseChippewaChoctawColombianColvilleComancheCosta RicanCreeCreekCroatianCrowCubanCypriotCzechCzechoslovakianDanishDelawareDominicanDutchDutch West IndianEastern EuropeanEcuadorianEgyptianEnglishEstonianEthiopianEuropeanFijianFilipinoFinnishFrenchFrench American IndianFrench CanadianGermanGerman RussianGhanaianGreekGuamanian/ChamorroGuatemalanGuyaneseHaitianHmongHonduranHopiHoumaHungarianIcelanderIndian (Asian)IndonesianInupiatIranianIraqiIrishIroquoisIsraeliItalianJamaicanJapaneseJordanianKenyanKiowaKoreanLaotianLatvianLebaneseLiberianLithuanianLumbeeLuxembourgerMacedonianMalaysianMalteseMarshalleseMenomineeMexicanMexican American IndianMongolianMoroccanNative HawaiianNavajoNepaleseNew ZealanderNicaraguanNigerianNorthern EuropeanNorwegianOkinawanOsageOttawaPaiutePakistaniPalestinianPanamanianParaguayanPennsylvania GermanPeruvianPimaPolishPortuguesePotawatomiPuebloPuerto RicanPuget Sound SalishRomanianRussianSalvadoranSamoanScandinavianScotch-IrishScottishSeminoleSerbianShoshoneSierra LeoneanSiouxSlavicSlovakSloveneSomaliSouth AfricanSouth AmericanSouth American IndianSoviet UnionSpaniardSpanishSpanish AmericanSpanish American IndianSri LankanSubsaharan AfricanSudaneseSwedishSwissSyrianTaiwaneseThaiTlingit-HaidaTohono O'OdhamTonganTrinidadian and TobagonianTsimshianTurkishU.S. Virgin IslanderUgandanUkrainianUruguayanUteVenezuelanVietnameseWelshWest IndianYakamaYaquiYugoslavianYumanYup'ikZimbabwean
Immigration
NonimmigrantsImmigrantsAfghanistanAfricaAlbaniaArgentinaArmeniaAsiaAustraliaAustriaBahamasBangladeshBarbadosBelarusBelgiumBelizeBoliviaBosnia and HerzegovinaBrazilBulgariaBurma/MyanmarCabo VerdeCambodiaCameroonCanadaCaribbeanCentral AmericaChileChinaColombiaCongoCosta RicaCroatiaCubaCzechoslovakiaDenmarkDominicaDominican RepublicEastern AfricaEastern AsiaEastern EuropeEcuadorEgyptEl SalvadorEnglandEritreaEthiopiaEuropeFijiFranceGermanyGhanaGreeceGrenadaGuatemalaGuyanaHaitiHondurasHong KongHungaryIndiaIndonesiaIranIraqIrelandIsraelItalyJamaicaJapanJordanKazakhstanKenyaKoreaKuwaitLaosLatin AmericaLatviaLebanonLiberiaLithuaniaMalaysiaMexicoMicronesiaMiddle AfricaMoldovaMoroccoNepalNetherlandsNicaraguaNigeriaNorth AmericaNorth MacedoniaNorthern AfricaNorthern EuropeNorwayOceaniaPakistanPanamaPeruPhilippinesPolandPortugalRomaniaRussiaSaudi ArabiaScotlandSenegalSerbiaSierra LeoneSingaporeSomaliaSouth AfricaSouth AmericaSouth Central AsiaSouth Eastern AsiaSouthern EuropeSpainSri LankaSt. Vincent and the GrenadinesSudanSwedenSwitzerlandSyriaTaiwanThailandTrinidad and TobagoTurkeyUgandaUkraineUruguayUzbekistanVenezuelaVietnamWest IndiesWestern AfricaWestern AsiaWestern EuropeYemenZaireZimbabweAzores
Senegalese
Race
Ancestry
AfghanAfricanAlaska NativeAlaskan AthabascanAlbanianAleutAlsatianAmericanApacheArabArapahoArgentineanArmenianAssyrian/Chaldean/SyriacAustralianAustrianBahamianBangladeshiBarbadianBasqueBelgianBelizeanBermudanBhutaneseBlackfeetBolivianBrazilianBritishBritish West IndianBulgarianBurmeseCajunCambodianCanadianCape VerdeanCarpatho RusynCelticCentral AmericanCentral American IndianCherokeeCheyenneChickasawChileanChineseChippewaChoctawColombianColvilleComancheCosta RicanCreeCreekCroatianCrowCubanCypriotCzechCzechoslovakianDanishDelawareDominicanDutchDutch West IndianEastern EuropeanEcuadorianEgyptianEnglishEstonianEthiopianEuropeanFijianFinnishFrenchFrench American IndianFrench CanadianGermanGerman RussianGhanaianGreekGuamanian/ChamorroGuatemalanGuyaneseHaitianHmongHonduranHopiHoumaHungarianIcelanderIndian (Asian)IndonesianInupiatIranianIraqiIrishIroquoisIsraeliItalianJamaicanJapaneseJordanianKenyanKiowaKoreanLaotianLatvianLebaneseLiberianLithuanianLumbeeLuxembourgerMacedonianMalaysianMalteseMarshalleseMenomineeMexicanMexican American IndianMongolianMoroccanNative HawaiianNavajoNepaleseNew ZealanderNicaraguanNigerianNorthern EuropeanNorwegianOkinawanOsageOttawaPaiutePakistaniPalestinianPanamanianParaguayanPennsylvania GermanPeruvianPimaPolishPortuguesePotawatomiPuebloPuerto RicanPuget Sound SalishRomanianRussianSalvadoranSamoanScandinavianScotch-IrishScottishSeminoleSenegaleseSerbianShoshoneSierra LeoneanSiouxSlavicSlovakSloveneSomaliSouth AfricanSouth AmericanSouth American IndianSoviet UnionSpaniardSpanishSpanish AmericanSpanish American IndianSri LankanSubsaharan AfricanSudaneseSwedishSwissSyrianTaiwaneseThaiTlingit-HaidaTohono O'OdhamTonganTrinidadian and TobagonianTsimshianTurkishU.S. Virgin IslanderUgandanUkrainianUruguayanUteVenezuelanVietnameseWelshWest IndianYakamaYaquiYugoslavianYumanYup'ikZimbabwean
Immigration
NonimmigrantsImmigrantsAfghanistanAfricaAlbaniaArgentinaArmeniaAsiaAustraliaAustriaBahamasBangladeshBarbadosBelarusBelgiumBelizeBoliviaBosnia and HerzegovinaBrazilBulgariaBurma/MyanmarCabo VerdeCambodiaCameroonCanadaCaribbeanCentral AmericaChileChinaColombiaCongoCosta RicaCroatiaCubaCzechoslovakiaDenmarkDominicaDominican RepublicEastern AfricaEastern AsiaEastern EuropeEcuadorEgyptEl SalvadorEnglandEritreaEthiopiaEuropeFijiFranceGermanyGhanaGreeceGrenadaGuatemalaGuyanaHaitiHondurasHong KongHungaryIndiaIndonesiaIranIraqIrelandIsraelItalyJamaicaJapanJordanKazakhstanKenyaKoreaKuwaitLaosLatin AmericaLatviaLebanonLiberiaLithuaniaMalaysiaMexicoMicronesiaMiddle AfricaMoldovaMoroccoNepalNetherlandsNicaraguaNigeriaNorth AmericaNorth MacedoniaNorthern AfricaNorthern EuropeNorwayOceaniaPakistanPanamaPeruPhilippinesPolandPortugalRomaniaRussiaSaudi ArabiaScotlandSenegalSerbiaSierra LeoneSingaporeSomaliaSouth AfricaSouth AmericaSouth Central AsiaSouth Eastern AsiaSouthern EuropeSpainSri LankaSt. Vincent and the GrenadinesSudanSwedenSwitzerlandSyriaTaiwanThailandTrinidad and TobagoTurkeyUgandaUkraineUruguayUzbekistanVenezuelaVietnamWest IndiesWestern AfricaWestern AsiaWestern EuropeYemenZaireZimbabweAzores
Unemployment Among Women with Children Under 6 years
Income
Poverty
Unemployment
Labor Participation
Family Structure
Vehicle Availability
Education Level
Disability

Unemployment Among Women with Children Under 6 years Comparison

Filipinos

Senegalese

Exceptional
Tragic
6.1%
UNEMPLOYMENT AMONG WOMEN WITH CHILDREN UNDER 6 YEARS
100.0/ 100
METRIC RATING
9th/ 347
METRIC RANK
8.0%
UNEMPLOYMENT AMONG WOMEN WITH CHILDREN UNDER 6 YEARS
6.2/ 100
METRIC RATING
226th/ 347
METRIC RANK

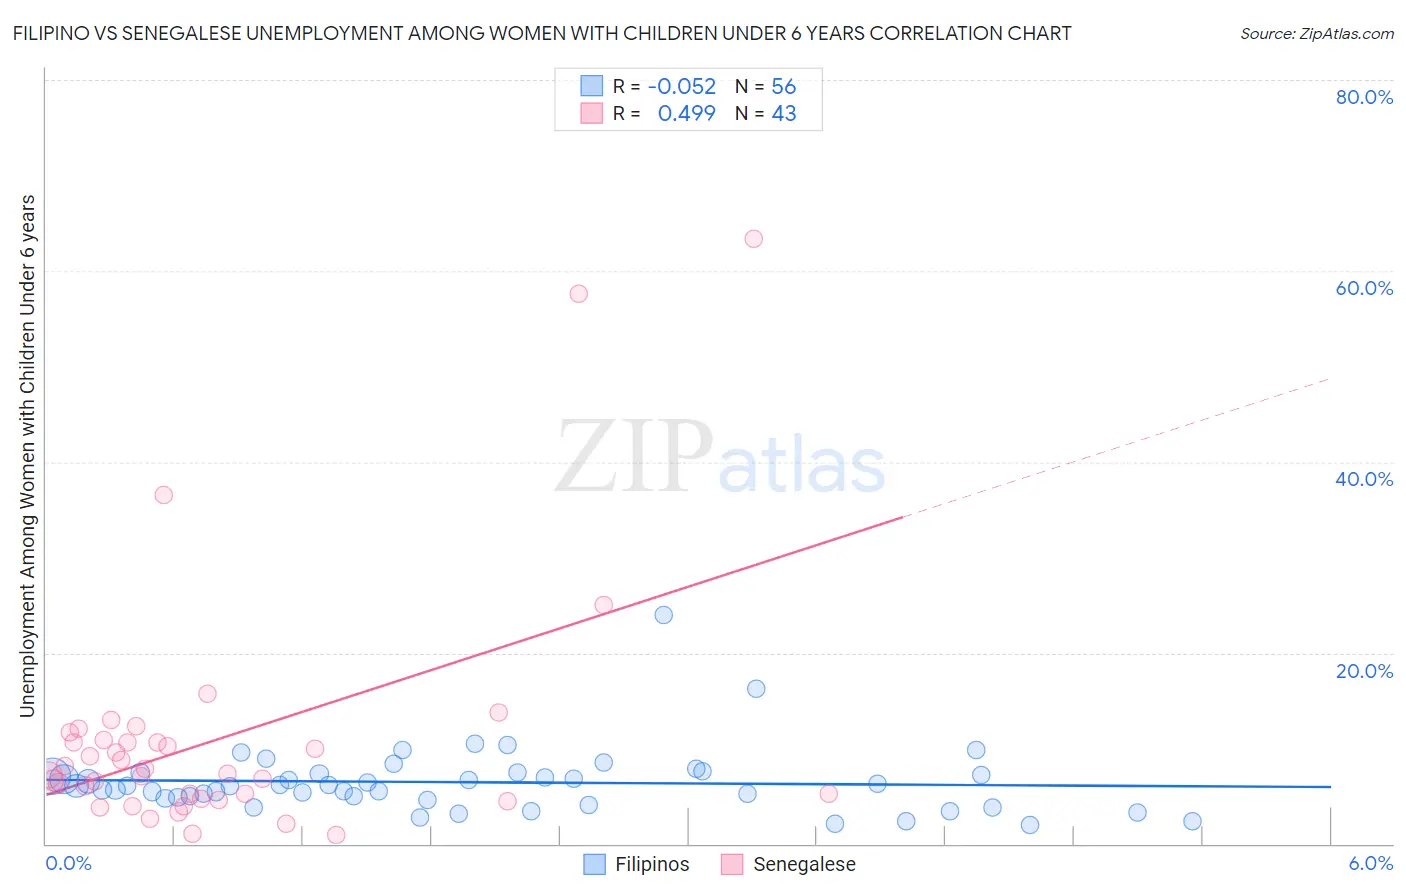
Filipino vs Senegalese Unemployment Among Women with Children Under 6 years Correlation Chart

The statistical analysis conducted on geographies consisting of 208,639,932 people shows a slight negative correlation between the proportion of Filipinos and unemployment rate among women with children under the age of 6 in the United States with a correlation coefficient (R) of -0.052 and weighted average of 6.1%. Similarly, the statistical analysis conducted on geographies consisting of 72,868,993 people shows a moderate positive correlation between the proportion of Senegalese and unemployment rate among women with children under the age of 6 in the United States with a correlation coefficient (R) of 0.499 and weighted average of 8.0%, a difference of 30.2%.
Filipino vs Senegalese Unemployment Among Women with Children Under 6 years

Unemployment Among Women with Children Under 6 years Correlation Summary

MeasurementFilipinoSenegalese
Minimum1.9%0.90%
Maximum23.9%63.4%
Range22.0%62.5%
Mean6.4%11.0%
Median6.1%7.3%
Interquartile 25% (IQ1)4.8%4.7%
Interquartile 75% (IQ3)7.4%10.8%
Interquartile Range (IQR)2.6%6.1%
Standard Deviation (Sample)3.5%12.7%
Standard Deviation (Population)3.4%12.5%

Similar Demographics by Unemployment Among Women with Children Under 6 years

Demographics Similar to Filipinos by Unemployment Among Women with Children Under 6 years

In terms of unemployment among women with children under 6 years, the demographic groups most similar to Filipinos are Immigrants from India (6.1%, a difference of 0.45%), Taiwanese (6.1%, a difference of 0.94%), Immigrants from Taiwan (6.0%, a difference of 1.5%), Immigrants from China (6.2%, a difference of 1.5%), and Indian (Asian) (6.3%, a difference of 2.6%).
DemographicsRating | RankUnemployment Among Women with Children Under 6 years
Immigrants | Hong Kong
100.0
/100
|
#2
Exceptional
5.8%
Okinawans
100.0
/100
|
#3
Exceptional
5.8%
Cambodians
100.0
/100
|
#4
Exceptional
5.9%
Cape Verdeans
100.0
/100
|
#5
Exceptional
5.9%
Immigrants | Taiwan
100.0
/100
|
#6
Exceptional
6.0%
Taiwanese
100.0
/100
|
#7
Exceptional
6.1%
Immigrants | India
100.0
/100
|
#8
Exceptional
6.1%
Filipinos
100.0
/100
|
#9
Exceptional
6.1%
Immigrants | China
100.0
/100
|
#10
Exceptional
6.2%
Indians (Asian)
100.0
/100
|
#11
Exceptional
6.3%
Immigrants | Singapore
100.0
/100
|
#12
Exceptional
6.3%
Immigrants | Eastern Asia
100.0
/100
|
#13
Exceptional
6.3%
Immigrants | Bulgaria
100.0
/100
|
#14
Exceptional
6.3%
Thais
100.0
/100
|
#15
Exceptional
6.3%
Immigrants | Uzbekistan
100.0
/100
|
#16
Exceptional
6.3%

Demographics Similar to Senegalese by Unemployment Among Women with Children Under 6 years

In terms of unemployment among women with children under 6 years, the demographic groups most similar to Senegalese are Portuguese (8.0%, a difference of 0.010%), Immigrants from Sudan (8.0%, a difference of 0.040%), Salvadoran (8.0%, a difference of 0.19%), German (8.0%, a difference of 0.22%), and English (8.0%, a difference of 0.25%).
DemographicsRating | RankUnemployment Among Women with Children Under 6 years
Arabs
9.4
/100
|
#219
Tragic
7.9%
South American Indians
9.3
/100
|
#220
Tragic
7.9%
Immigrants | Germany
8.5
/100
|
#221
Tragic
7.9%
Samoans
8.4
/100
|
#222
Tragic
7.9%
Carpatho Rusyns
7.8
/100
|
#223
Tragic
8.0%
English
7.2
/100
|
#224
Tragic
8.0%
Germans
7.0
/100
|
#225
Tragic
8.0%
Senegalese
6.2
/100
|
#226
Tragic
8.0%
Portuguese
6.2
/100
|
#227
Tragic
8.0%
Immigrants | Sudan
6.0
/100
|
#228
Tragic
8.0%
Salvadorans
5.5
/100
|
#229
Tragic
8.0%
Finns
5.3
/100
|
#230
Tragic
8.0%
Trinidadians and Tobagonians
5.3
/100
|
#231
Tragic
8.0%
Welsh
5.0
/100
|
#232
Tragic
8.0%
Immigrants | Trinidad and Tobago
4.8
/100
|
#233
Tragic
8.0%