Filipino vs Immigrants from Sierra Leone Unemployment Among Women with Children Under 6 years
COMPARE
Filipino
Immigrants from Sierra Leone
Unemployment Among Women with Children Under 6 years
Unemployment Among Women with Children Under 6 years Comparison
Filipinos
Immigrants from Sierra Leone
6.1%
UNEMPLOYMENT AMONG WOMEN WITH CHILDREN UNDER 6 YEARS
100.0/ 100
METRIC RATING
9th/ 347
METRIC RANK
8.2%
UNEMPLOYMENT AMONG WOMEN WITH CHILDREN UNDER 6 YEARS
1.1/ 100
METRIC RATING
249th/ 347
METRIC RANK
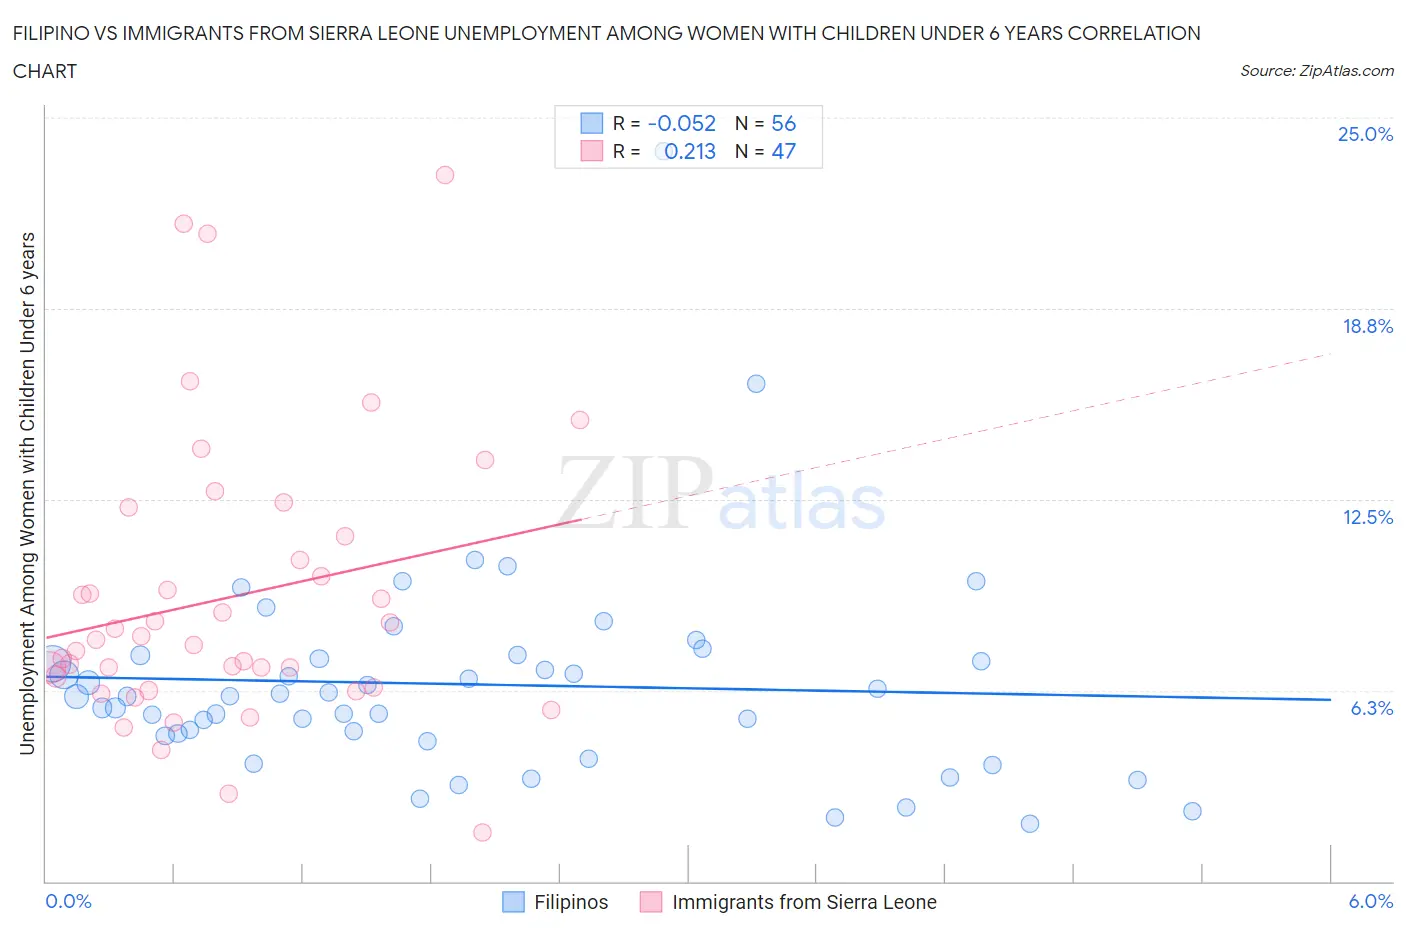
Filipino vs Immigrants from Sierra Leone Unemployment Among Women with Children Under 6 years Correlation Chart
The statistical analysis conducted on geographies consisting of 208,639,932 people shows a slight negative correlation between the proportion of Filipinos and unemployment rate among women with children under the age of 6 in the United States with a correlation coefficient (R) of -0.052 and weighted average of 6.1%. Similarly, the statistical analysis conducted on geographies consisting of 92,718,305 people shows a weak positive correlation between the proportion of Immigrants from Sierra Leone and unemployment rate among women with children under the age of 6 in the United States with a correlation coefficient (R) of 0.213 and weighted average of 8.2%, a difference of 33.9%.
Unemployment Among Women with Children Under 6 years Correlation Summary
| Measurement | Filipino | Immigrants from Sierra Leone |
| Minimum | 1.9% | 1.6% |
| Maximum | 23.9% | 23.1% |
| Range | 22.0% | 21.5% |
| Mean | 6.4% | 9.3% |
| Median | 6.1% | 7.9% |
| Interquartile 25% (IQ1) | 4.8% | 6.3% |
| Interquartile 75% (IQ3) | 7.4% | 11.3% |
| Interquartile Range (IQR) | 2.6% | 5.0% |
| Standard Deviation (Sample) | 3.5% | 4.6% |
| Standard Deviation (Population) | 3.4% | 4.6% |
Similar Demographics by Unemployment Among Women with Children Under 6 years
Demographics Similar to Filipinos by Unemployment Among Women with Children Under 6 years
In terms of unemployment among women with children under 6 years, the demographic groups most similar to Filipinos are Immigrants from India (6.1%, a difference of 0.45%), Taiwanese (6.1%, a difference of 0.94%), Immigrants from Taiwan (6.0%, a difference of 1.5%), Immigrants from China (6.2%, a difference of 1.5%), and Indian (Asian) (6.3%, a difference of 2.6%).
| Demographics | Rating | Rank | Unemployment Among Women with Children Under 6 years |
| Immigrants | Hong Kong | 100.0 /100 | #2 | Exceptional 5.8% |
| Okinawans | 100.0 /100 | #3 | Exceptional 5.8% |
| Cambodians | 100.0 /100 | #4 | Exceptional 5.9% |
| Cape Verdeans | 100.0 /100 | #5 | Exceptional 5.9% |
| Immigrants | Taiwan | 100.0 /100 | #6 | Exceptional 6.0% |
| Taiwanese | 100.0 /100 | #7 | Exceptional 6.1% |
| Immigrants | India | 100.0 /100 | #8 | Exceptional 6.1% |
| Filipinos | 100.0 /100 | #9 | Exceptional 6.1% |
| Immigrants | China | 100.0 /100 | #10 | Exceptional 6.2% |
| Indians (Asian) | 100.0 /100 | #11 | Exceptional 6.3% |
| Immigrants | Singapore | 100.0 /100 | #12 | Exceptional 6.3% |
| Immigrants | Eastern Asia | 100.0 /100 | #13 | Exceptional 6.3% |
| Immigrants | Bulgaria | 100.0 /100 | #14 | Exceptional 6.3% |
| Thais | 100.0 /100 | #15 | Exceptional 6.3% |
| Immigrants | Uzbekistan | 100.0 /100 | #16 | Exceptional 6.3% |
Demographics Similar to Immigrants from Sierra Leone by Unemployment Among Women with Children Under 6 years
In terms of unemployment among women with children under 6 years, the demographic groups most similar to Immigrants from Sierra Leone are Nigerian (8.2%, a difference of 0.010%), Immigrants from Western Africa (8.2%, a difference of 0.090%), German Russian (8.2%, a difference of 0.13%), Guyanese (8.2%, a difference of 0.18%), and Ghanaian (8.2%, a difference of 0.18%).
| Demographics | Rating | Rank | Unemployment Among Women with Children Under 6 years |
| Dutch | 2.5 /100 | #242 | Tragic 8.1% |
| Hawaiians | 1.8 /100 | #243 | Tragic 8.2% |
| French | 1.7 /100 | #244 | Tragic 8.2% |
| Native Hawaiians | 1.7 /100 | #245 | Tragic 8.2% |
| Central Americans | 1.4 /100 | #246 | Tragic 8.2% |
| German Russians | 1.2 /100 | #247 | Tragic 8.2% |
| Immigrants | Western Africa | 1.1 /100 | #248 | Tragic 8.2% |
| Immigrants | Sierra Leone | 1.1 /100 | #249 | Tragic 8.2% |
| Nigerians | 1.1 /100 | #250 | Tragic 8.2% |
| Guyanese | 1.0 /100 | #251 | Tragic 8.2% |
| Ghanaians | 1.0 /100 | #252 | Tragic 8.2% |
| Immigrants | Guyana | 0.8 /100 | #253 | Tragic 8.2% |
| Immigrants | Caribbean | 0.7 /100 | #254 | Tragic 8.3% |
| Immigrants | Portugal | 0.6 /100 | #255 | Tragic 8.3% |
| Celtics | 0.6 /100 | #256 | Tragic 8.3% |