Filipino vs Estonian Unemployment Among Women with Children Under 6 years
COMPARE
Filipino
Estonian
Unemployment Among Women with Children Under 6 years
Unemployment Among Women with Children Under 6 years Comparison
Filipinos
Estonians
6.1%
UNEMPLOYMENT AMONG WOMEN WITH CHILDREN UNDER 6 YEARS
100.0/ 100
METRIC RATING
9th/ 347
METRIC RANK
7.1%
UNEMPLOYMENT AMONG WOMEN WITH CHILDREN UNDER 6 YEARS
99.0/ 100
METRIC RATING
76th/ 347
METRIC RANK
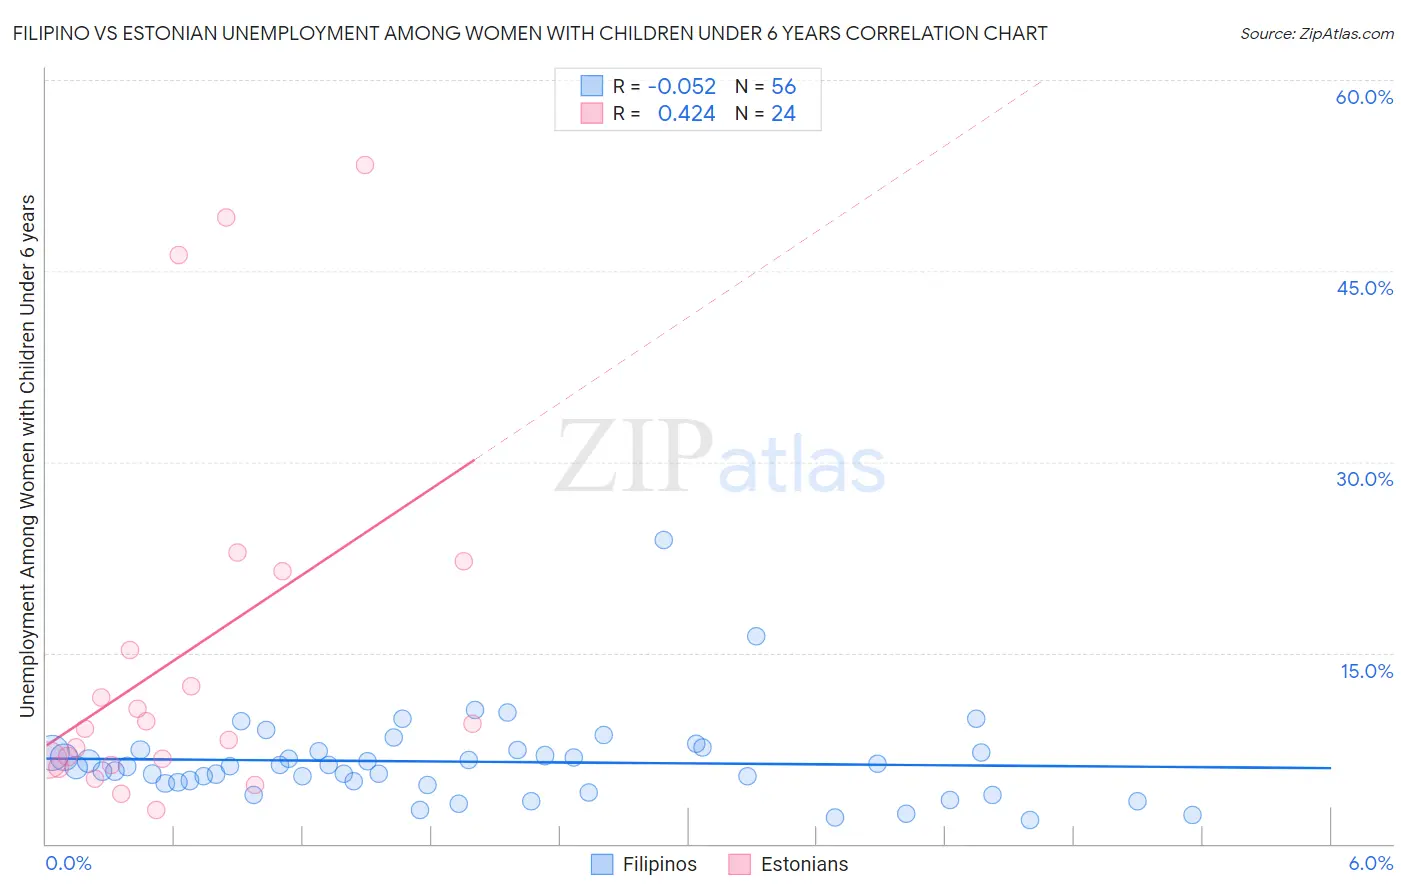
Filipino vs Estonian Unemployment Among Women with Children Under 6 years Correlation Chart
The statistical analysis conducted on geographies consisting of 208,639,932 people shows a slight negative correlation between the proportion of Filipinos and unemployment rate among women with children under the age of 6 in the United States with a correlation coefficient (R) of -0.052 and weighted average of 6.1%. Similarly, the statistical analysis conducted on geographies consisting of 107,788,240 people shows a moderate positive correlation between the proportion of Estonians and unemployment rate among women with children under the age of 6 in the United States with a correlation coefficient (R) of 0.424 and weighted average of 7.1%, a difference of 15.2%.
Unemployment Among Women with Children Under 6 years Correlation Summary
| Measurement | Filipino | Estonian |
| Minimum | 1.9% | 2.7% |
| Maximum | 23.9% | 53.3% |
| Range | 22.0% | 50.6% |
| Mean | 6.4% | 14.9% |
| Median | 6.1% | 9.2% |
| Interquartile 25% (IQ1) | 4.8% | 6.4% |
| Interquartile 75% (IQ3) | 7.4% | 18.3% |
| Interquartile Range (IQR) | 2.6% | 11.9% |
| Standard Deviation (Sample) | 3.5% | 14.5% |
| Standard Deviation (Population) | 3.4% | 14.2% |
Similar Demographics by Unemployment Among Women with Children Under 6 years
Demographics Similar to Filipinos by Unemployment Among Women with Children Under 6 years
In terms of unemployment among women with children under 6 years, the demographic groups most similar to Filipinos are Immigrants from India (6.1%, a difference of 0.45%), Taiwanese (6.1%, a difference of 0.94%), Immigrants from Taiwan (6.0%, a difference of 1.5%), Immigrants from China (6.2%, a difference of 1.5%), and Indian (Asian) (6.3%, a difference of 2.6%).
| Demographics | Rating | Rank | Unemployment Among Women with Children Under 6 years |
| Immigrants | Hong Kong | 100.0 /100 | #2 | Exceptional 5.8% |
| Okinawans | 100.0 /100 | #3 | Exceptional 5.8% |
| Cambodians | 100.0 /100 | #4 | Exceptional 5.9% |
| Cape Verdeans | 100.0 /100 | #5 | Exceptional 5.9% |
| Immigrants | Taiwan | 100.0 /100 | #6 | Exceptional 6.0% |
| Taiwanese | 100.0 /100 | #7 | Exceptional 6.1% |
| Immigrants | India | 100.0 /100 | #8 | Exceptional 6.1% |
| Filipinos | 100.0 /100 | #9 | Exceptional 6.1% |
| Immigrants | China | 100.0 /100 | #10 | Exceptional 6.2% |
| Indians (Asian) | 100.0 /100 | #11 | Exceptional 6.3% |
| Immigrants | Singapore | 100.0 /100 | #12 | Exceptional 6.3% |
| Immigrants | Eastern Asia | 100.0 /100 | #13 | Exceptional 6.3% |
| Immigrants | Bulgaria | 100.0 /100 | #14 | Exceptional 6.3% |
| Thais | 100.0 /100 | #15 | Exceptional 6.3% |
| Immigrants | Uzbekistan | 100.0 /100 | #16 | Exceptional 6.3% |
Demographics Similar to Estonians by Unemployment Among Women with Children Under 6 years
In terms of unemployment among women with children under 6 years, the demographic groups most similar to Estonians are Immigrants from Croatia (7.1%, a difference of 0.030%), Immigrants from Eastern Europe (7.1%, a difference of 0.050%), Immigrants from Somalia (7.1%, a difference of 0.070%), Immigrants from Fiji (7.1%, a difference of 0.12%), and Immigrants from Greece (7.1%, a difference of 0.15%).
| Demographics | Rating | Rank | Unemployment Among Women with Children Under 6 years |
| Immigrants | Eritrea | 99.4 /100 | #69 | Exceptional 7.0% |
| Immigrants | Iraq | 99.4 /100 | #70 | Exceptional 7.0% |
| Afghans | 99.4 /100 | #71 | Exceptional 7.0% |
| Cubans | 99.4 /100 | #72 | Exceptional 7.0% |
| Immigrants | Czechoslovakia | 99.2 /100 | #73 | Exceptional 7.0% |
| Turks | 99.2 /100 | #74 | Exceptional 7.0% |
| Immigrants | Eastern Europe | 99.0 /100 | #75 | Exceptional 7.1% |
| Estonians | 99.0 /100 | #76 | Exceptional 7.1% |
| Immigrants | Croatia | 98.9 /100 | #77 | Exceptional 7.1% |
| Immigrants | Somalia | 98.9 /100 | #78 | Exceptional 7.1% |
| Immigrants | Fiji | 98.9 /100 | #79 | Exceptional 7.1% |
| Immigrants | Greece | 98.9 /100 | #80 | Exceptional 7.1% |
| Immigrants | Venezuela | 98.8 /100 | #81 | Exceptional 7.1% |
| Immigrants | Afghanistan | 98.7 /100 | #82 | Exceptional 7.1% |
| Egyptians | 98.7 /100 | #83 | Exceptional 7.1% |