Filipino vs Immigrants from Middle Africa In Labor Force | Age 45-54
COMPARE
Filipino
Immigrants from Middle Africa
In Labor Force | Age 45-54
In Labor Force | Age 45-54 Comparison
Filipinos
Immigrants from Middle Africa
83.5%
IN LABOR FORCE | AGE 45-54
98.3/ 100
METRIC RATING
61st/ 347
METRIC RANK
83.3%
IN LABOR FORCE | AGE 45-54
94.3/ 100
METRIC RATING
99th/ 347
METRIC RANK
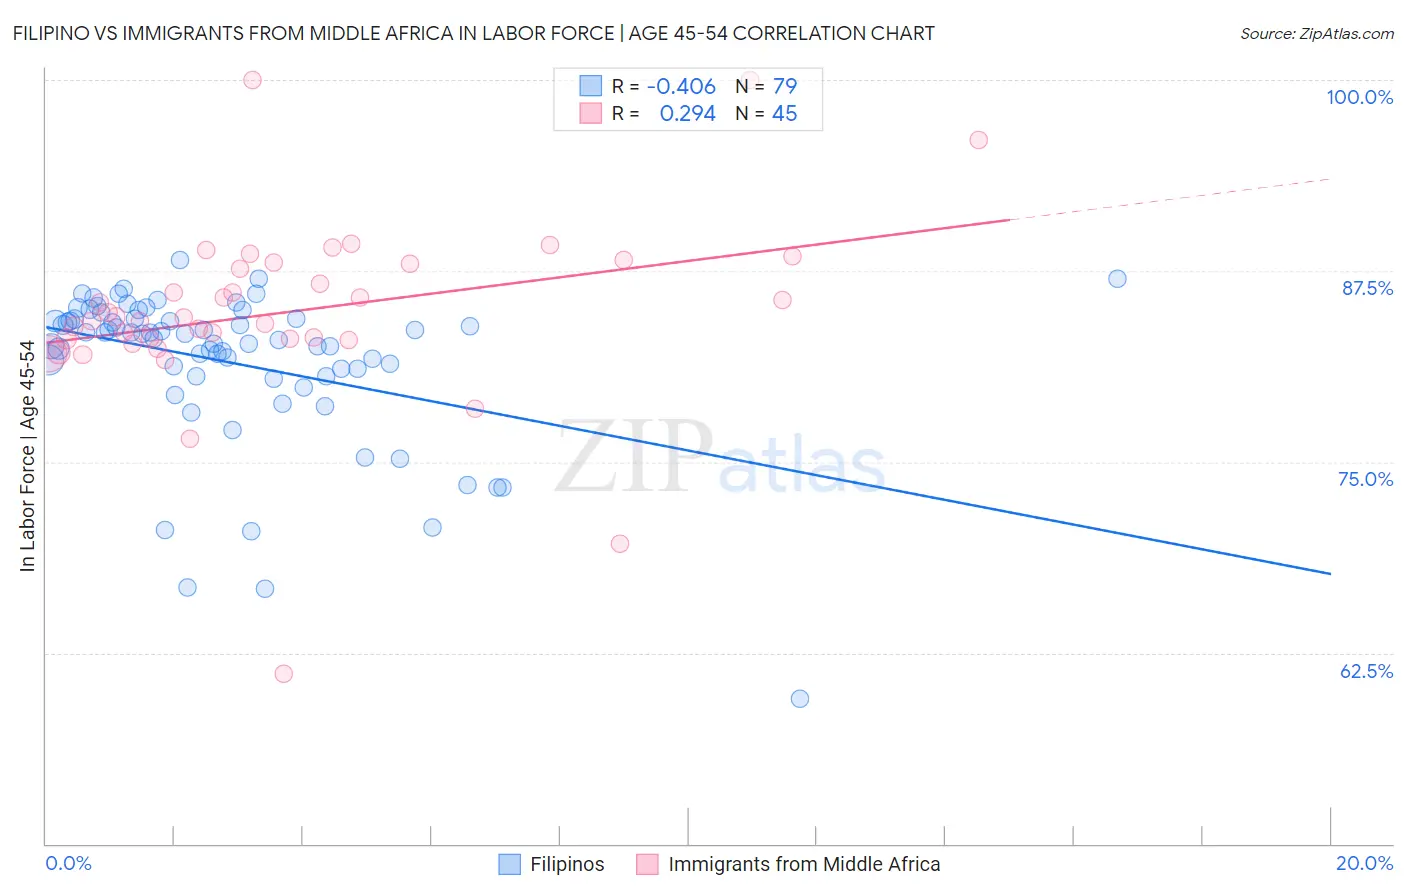
Filipino vs Immigrants from Middle Africa In Labor Force | Age 45-54 Correlation Chart
The statistical analysis conducted on geographies consisting of 254,168,663 people shows a moderate negative correlation between the proportion of Filipinos and labor force participation rate among population between the ages 45 and 54 in the United States with a correlation coefficient (R) of -0.406 and weighted average of 83.5%. Similarly, the statistical analysis conducted on geographies consisting of 202,639,342 people shows a weak positive correlation between the proportion of Immigrants from Middle Africa and labor force participation rate among population between the ages 45 and 54 in the United States with a correlation coefficient (R) of 0.294 and weighted average of 83.3%, a difference of 0.27%.
In Labor Force | Age 45-54 Correlation Summary
| Measurement | Filipino | Immigrants from Middle Africa |
| Minimum | 59.5% | 61.1% |
| Maximum | 88.2% | 100.0% |
| Range | 28.7% | 38.9% |
| Mean | 81.5% | 84.8% |
| Median | 83.4% | 84.4% |
| Interquartile 25% (IQ1) | 80.6% | 83.0% |
| Interquartile 75% (IQ3) | 84.4% | 88.0% |
| Interquartile Range (IQR) | 3.8% | 5.0% |
| Standard Deviation (Sample) | 5.2% | 6.2% |
| Standard Deviation (Population) | 5.1% | 6.2% |
Similar Demographics by In Labor Force | Age 45-54
Demographics Similar to Filipinos by In Labor Force | Age 45-54
In terms of in labor force | age 45-54, the demographic groups most similar to Filipinos are Carpatho Rusyn (83.5%, a difference of 0.0%), Bhutanese (83.5%, a difference of 0.010%), Eastern European (83.5%, a difference of 0.020%), Paraguayan (83.5%, a difference of 0.030%), and Immigrants from Taiwan (83.5%, a difference of 0.030%).
| Demographics | Rating | Rank | In Labor Force | Age 45-54 |
| Somalis | 98.7 /100 | #54 | Exceptional 83.5% |
| Macedonians | 98.7 /100 | #55 | Exceptional 83.5% |
| Immigrants | Peru | 98.6 /100 | #56 | Exceptional 83.5% |
| Paraguayans | 98.5 /100 | #57 | Exceptional 83.5% |
| Eastern Europeans | 98.5 /100 | #58 | Exceptional 83.5% |
| Bhutanese | 98.3 /100 | #59 | Exceptional 83.5% |
| Carpatho Rusyns | 98.3 /100 | #60 | Exceptional 83.5% |
| Filipinos | 98.3 /100 | #61 | Exceptional 83.5% |
| Immigrants | Taiwan | 98.0 /100 | #62 | Exceptional 83.5% |
| Afghans | 97.9 /100 | #63 | Exceptional 83.5% |
| Immigrants | Kenya | 97.9 /100 | #64 | Exceptional 83.5% |
| Egyptians | 97.9 /100 | #65 | Exceptional 83.5% |
| Asians | 97.7 /100 | #66 | Exceptional 83.4% |
| Chileans | 97.7 /100 | #67 | Exceptional 83.4% |
| Immigrants | Colombia | 97.6 /100 | #68 | Exceptional 83.4% |
Demographics Similar to Immigrants from Middle Africa by In Labor Force | Age 45-54
In terms of in labor force | age 45-54, the demographic groups most similar to Immigrants from Middle Africa are Mongolian (83.3%, a difference of 0.0%), Maltese (83.3%, a difference of 0.010%), Immigrants from Belarus (83.3%, a difference of 0.010%), Immigrants from Singapore (83.3%, a difference of 0.010%), and Albanian (83.3%, a difference of 0.010%).
| Demographics | Rating | Rank | In Labor Force | Age 45-54 |
| Danes | 95.3 /100 | #92 | Exceptional 83.3% |
| Italians | 95.1 /100 | #93 | Exceptional 83.3% |
| Argentineans | 94.9 /100 | #94 | Exceptional 83.3% |
| Immigrants | Argentina | 94.9 /100 | #95 | Exceptional 83.3% |
| Immigrants | Kuwait | 94.8 /100 | #96 | Exceptional 83.3% |
| Palestinians | 94.8 /100 | #97 | Exceptional 83.3% |
| Maltese | 94.4 /100 | #98 | Exceptional 83.3% |
| Immigrants | Middle Africa | 94.3 /100 | #99 | Exceptional 83.3% |
| Mongolians | 94.2 /100 | #100 | Exceptional 83.3% |
| Immigrants | Belarus | 94.1 /100 | #101 | Exceptional 83.3% |
| Immigrants | Singapore | 93.9 /100 | #102 | Exceptional 83.3% |
| Albanians | 93.9 /100 | #103 | Exceptional 83.3% |
| Immigrants | Romania | 93.8 /100 | #104 | Exceptional 83.3% |
| Immigrants | South America | 93.5 /100 | #105 | Exceptional 83.2% |
| Sri Lankans | 93.2 /100 | #106 | Exceptional 83.2% |