Immigrants from Korea vs Immigrants from Middle Africa Unemployment Among Women with Children Under 6 years
COMPARE
Immigrants from Korea
Immigrants from Middle Africa
Unemployment Among Women with Children Under 6 years
Unemployment Among Women with Children Under 6 years Comparison
Immigrants from Korea
Immigrants from Middle Africa
6.5%
UNEMPLOYMENT AMONG WOMEN WITH CHILDREN UNDER 6 YEARS
100.0/ 100
METRIC RATING
22nd/ 347
METRIC RANK
8.1%
UNEMPLOYMENT AMONG WOMEN WITH CHILDREN UNDER 6 YEARS
3.2/ 100
METRIC RATING
238th/ 347
METRIC RANK
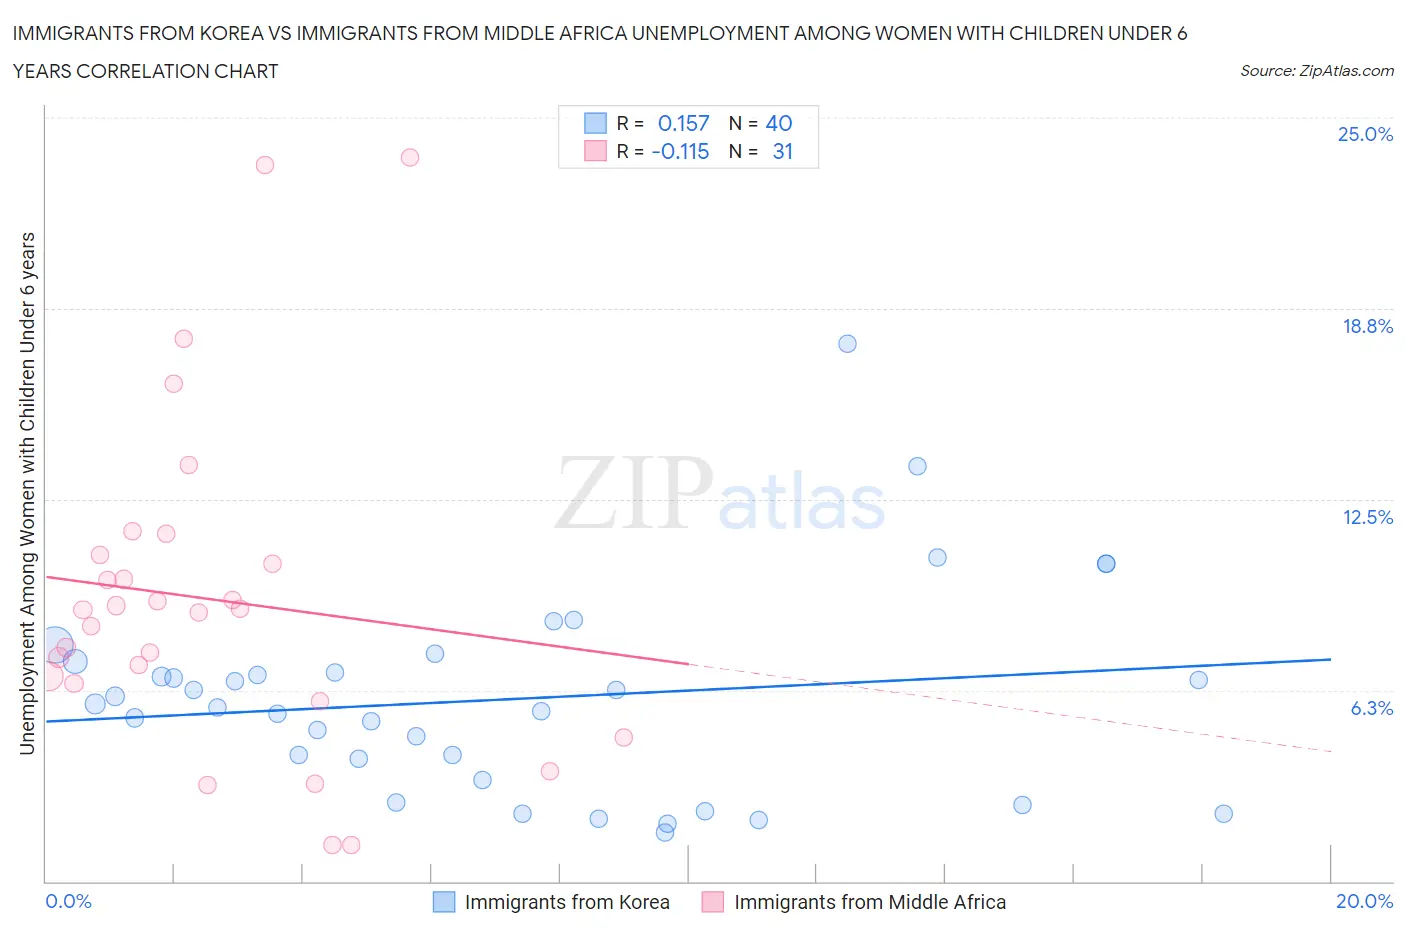
Immigrants from Korea vs Immigrants from Middle Africa Unemployment Among Women with Children Under 6 years Correlation Chart
The statistical analysis conducted on geographies consisting of 313,093,408 people shows a poor positive correlation between the proportion of Immigrants from Korea and unemployment rate among women with children under the age of 6 in the United States with a correlation coefficient (R) of 0.157 and weighted average of 6.5%. Similarly, the statistical analysis conducted on geographies consisting of 174,129,254 people shows a poor negative correlation between the proportion of Immigrants from Middle Africa and unemployment rate among women with children under the age of 6 in the United States with a correlation coefficient (R) of -0.115 and weighted average of 8.1%, a difference of 24.1%.
Unemployment Among Women with Children Under 6 years Correlation Summary
| Measurement | Immigrants from Korea | Immigrants from Middle Africa |
| Minimum | 1.6% | 1.2% |
| Maximum | 17.6% | 23.7% |
| Range | 16.0% | 22.5% |
| Mean | 6.0% | 9.2% |
| Median | 5.7% | 8.9% |
| Interquartile 25% (IQ1) | 3.7% | 6.5% |
| Interquartile 75% (IQ3) | 7.0% | 10.7% |
| Interquartile Range (IQR) | 3.3% | 4.2% |
| Standard Deviation (Sample) | 3.3% | 5.4% |
| Standard Deviation (Population) | 3.3% | 5.3% |
Similar Demographics by Unemployment Among Women with Children Under 6 years
Demographics Similar to Immigrants from Korea by Unemployment Among Women with Children Under 6 years
In terms of unemployment among women with children under 6 years, the demographic groups most similar to Immigrants from Korea are Bulgarian (6.5%, a difference of 0.20%), Laotian (6.5%, a difference of 0.34%), Soviet Union (6.5%, a difference of 0.36%), Burmese (6.5%, a difference of 0.42%), and Cypriot (6.5%, a difference of 0.45%).
| Demographics | Rating | Rank | Unemployment Among Women with Children Under 6 years |
| Thais | 100.0 /100 | #15 | Exceptional 6.3% |
| Immigrants | Uzbekistan | 100.0 /100 | #16 | Exceptional 6.3% |
| Immigrants | Malaysia | 100.0 /100 | #17 | Exceptional 6.4% |
| Assyrians/Chaldeans/Syriacs | 100.0 /100 | #18 | Exceptional 6.5% |
| Mongolians | 100.0 /100 | #19 | Exceptional 6.5% |
| Ute | 100.0 /100 | #20 | Exceptional 6.5% |
| Burmese | 100.0 /100 | #21 | Exceptional 6.5% |
| Immigrants | Korea | 100.0 /100 | #22 | Exceptional 6.5% |
| Bulgarians | 100.0 /100 | #23 | Exceptional 6.5% |
| Laotians | 100.0 /100 | #24 | Exceptional 6.5% |
| Soviet Union | 100.0 /100 | #25 | Exceptional 6.5% |
| Cypriots | 100.0 /100 | #26 | Exceptional 6.5% |
| Immigrants | Japan | 100.0 /100 | #27 | Exceptional 6.5% |
| Immigrants | Israel | 100.0 /100 | #28 | Exceptional 6.5% |
| Immigrants | Sweden | 100.0 /100 | #29 | Exceptional 6.6% |
Demographics Similar to Immigrants from Middle Africa by Unemployment Among Women with Children Under 6 years
In terms of unemployment among women with children under 6 years, the demographic groups most similar to Immigrants from Middle Africa are Irish (8.1%, a difference of 0.26%), Immigrants from El Salvador (8.1%, a difference of 0.34%), Liberian (8.1%, a difference of 0.36%), Immigrants from Costa Rica (8.0%, a difference of 0.38%), and Dutch (8.1%, a difference of 0.42%).
| Demographics | Rating | Rank | Unemployment Among Women with Children Under 6 years |
| Trinidadians and Tobagonians | 5.3 /100 | #231 | Tragic 8.0% |
| Welsh | 5.0 /100 | #232 | Tragic 8.0% |
| Immigrants | Trinidad and Tobago | 4.8 /100 | #233 | Tragic 8.0% |
| Kiowa | 4.4 /100 | #234 | Tragic 8.0% |
| Comanche | 4.3 /100 | #235 | Tragic 8.0% |
| Immigrants | Barbados | 4.2 /100 | #236 | Tragic 8.0% |
| Immigrants | Costa Rica | 4.1 /100 | #237 | Tragic 8.0% |
| Immigrants | Middle Africa | 3.2 /100 | #238 | Tragic 8.1% |
| Irish | 2.7 /100 | #239 | Tragic 8.1% |
| Immigrants | El Salvador | 2.6 /100 | #240 | Tragic 8.1% |
| Liberians | 2.6 /100 | #241 | Tragic 8.1% |
| Dutch | 2.5 /100 | #242 | Tragic 8.1% |
| Hawaiians | 1.8 /100 | #243 | Tragic 8.2% |
| French | 1.7 /100 | #244 | Tragic 8.2% |
| Native Hawaiians | 1.7 /100 | #245 | Tragic 8.2% |